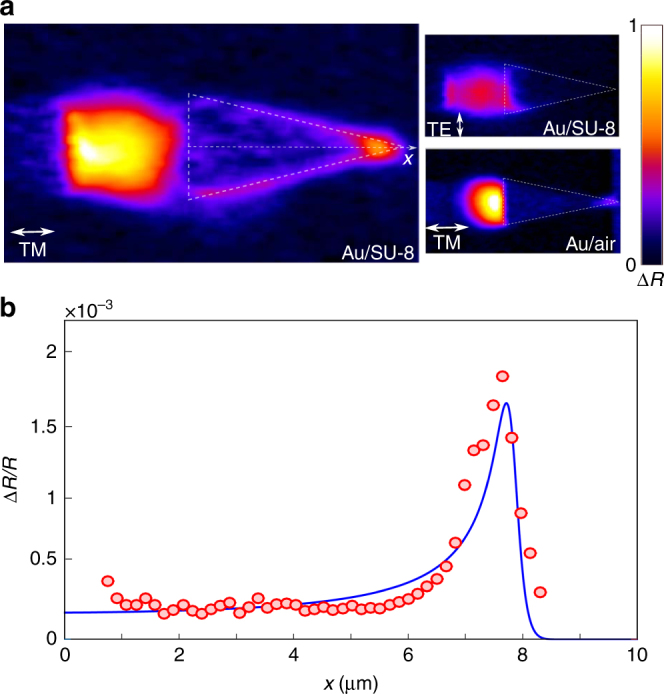
Fig. 3.

SPP damping rate enhancement at the tip apex. a ΔR image recorded for Δt = 1 ps corresponding to a maximum signal at the taper apex. The superimposed thin-dashed lines show the taper contours. Uppermost inset: ΔR image recorded for a pump-beam polarized parallel to the slits. Lowermost inset: ΔR image recorded for TM polarization with a probe beam incident from air and focused on the air/Au interface. The ΔR images are 16 × 7 μm2 large and are displayed with the same color scale. b Lineshape of the normalized reflectance variation ΔR(x)/R(x) recorded along the taper longitudinal x-axis
