Fig. 5.
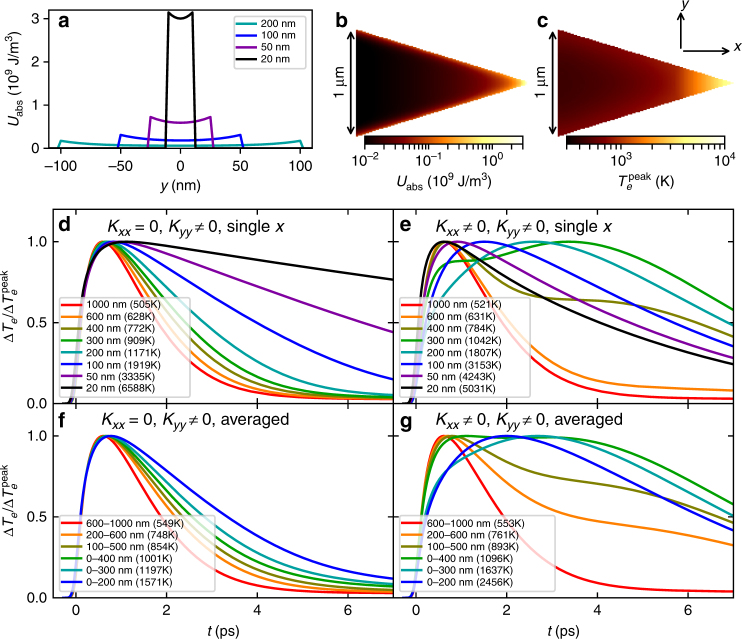
Impact of spatial confinement and heat flow on the rising time. Computed absorbed energy-density profile for an SPP at λ 0 = 800 nm assuming 1-nJ pump pulse energy (a) for four taper widths and b over an area of the taper close to the apex. c shows the corresponding peak electron temperature predicted by TTM simulations. d, e show the simulated temperature profiles at various widths accounting only for heat flow along y in d and fully accounting for both directions in e. f, g show the corresponding temperatures averaged over ranges of widths, to account for the finite size of the probe beam. To show the rise and fall times clearly, the temperature profiles in d–g are normalized to their peak temperatures, which are indicated in parenthesis in the legends. Comparing g–f shows that heat flow from the apex with enhanced absorption due to SPP slowdown is responsible for the observed increase in rising time

