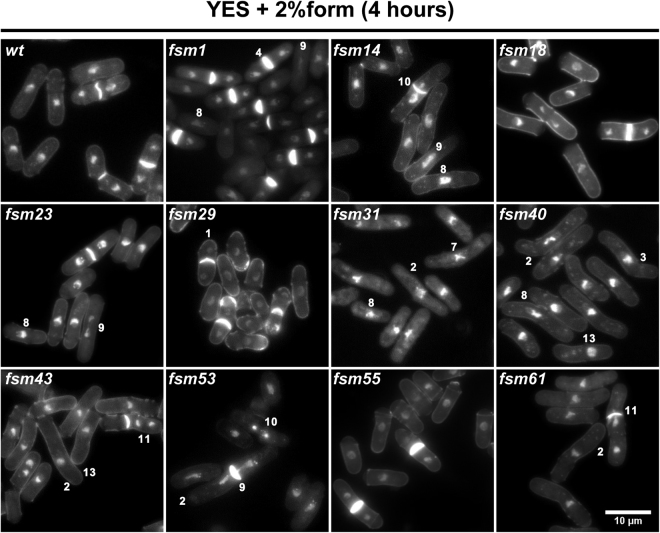
Figure 4.
Phenotype range in fsm strains in cluster III. DAPI/calcofluor co-staining micrographs of cluster III mutants in the presence of formamide for 4 hours at 30°. A wide range of cell cycle defects is observed in this collection of mutants: numbers denote example cells of phenotypes listed in Fig. 3. Scale bar: 10 µm. Micrographs of all remaining mutants at restrictive conditions for four hours are presented in Supplementary Figure 3.

