Fig. 1.
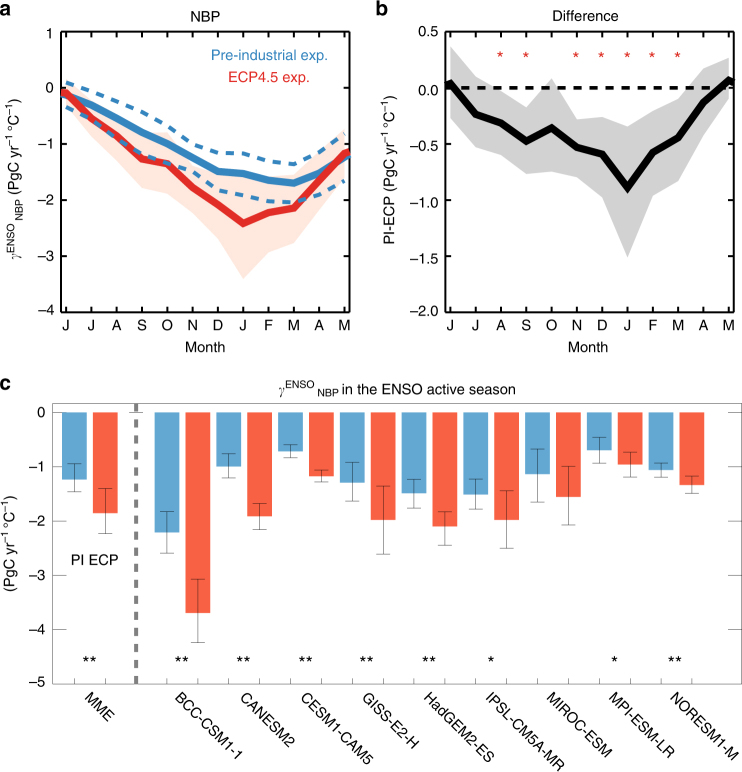
Net biome production sensitivities to ENSO. a Regression coefficients of carbon-flux anomalies in the range 40 °S–40 °N for the December–February (DJF) Niño3.4 index for net biome production (NBP) based on the preindustrial experiment (blue) and ECP4.5 (red), and b the differences between the two experiments . Shaded area and dashed lines indicate 95% confidence levels calculated using the bootstrap method. Red stars indicate significant months for at 95% confidence levels. c Regression coefficients of NBP anomalies from September to February in the range 40 °S–40 °N for DJF Niño3.4 for the preindustrial experiment and ECP4.5 based on multimodel ensemble (MME, left) as simple arithmetic mean of nine Earth System Models (ESMs) and individual ESMs (right). Error bars indicate 95% confidence levels of regression coefficients calculated by using bootstrap method. *P < 0.1 and **P < 0.05 for difference between two experiments in regression coefficients being significantly different from zero

