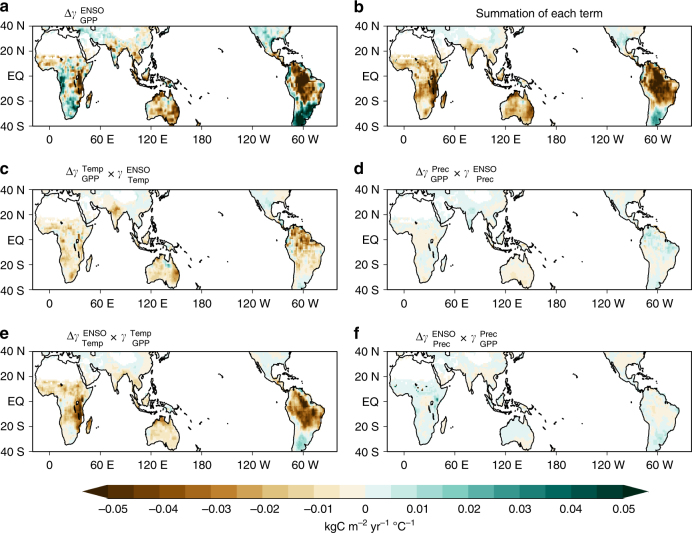
Fig. 2.
Sensitivity contributions to enhanced gross primary production response to ENSO. a Differences in the regression coefficient of gross primary production (GPP) anomalies from September to February for the December–February Niño3.4 index between the preindustrial experiment and ECP4.5. b Sum of changes in sensitivities based on each term in Eq. (4). c–f Each term in Eq. (4) plotted as a contribution to future changes in the response to ENSO and the GPP sensitivity changes to c temperature and d precipitation ; the GPP response to ENSO due to e temperature and f precipitation . Units are kgC m−2 yr−1 °C−1

