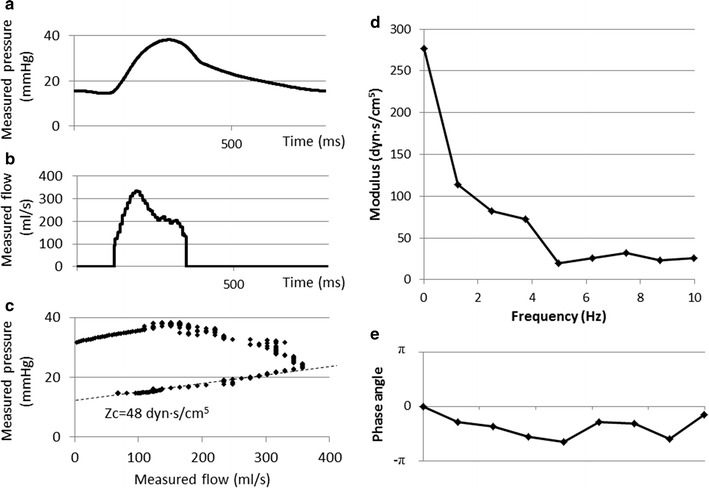
Fig. 5.

Computation of pulmonary input impedance. a, b Pressure and flow waveforms, respectively, recorded simultaneously. c Characteristic impedance (Zc) obtained from the instantaneous pulmonary pressure–flow plot (time domain manner) [13]. d, e Modulus and phase angle of the pulmonary input impedance computed from decomposed Fourier transform of pressure and flow, respectively
