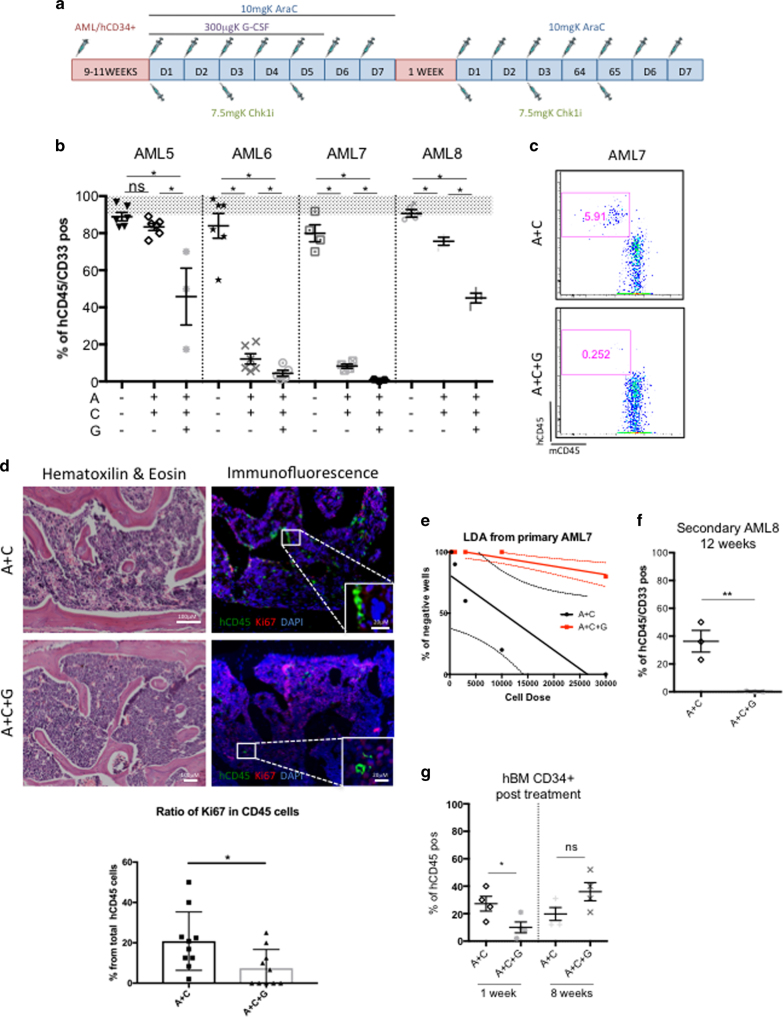
Fig. 5.
G-CSF enhances the cytotoxicity of AraC+CHK1i on AML in vivo. a Treatment regimen for AraC, CHK1i, and G-CSF with primary AML samples and normal hematopoietic cells, in vivo. b Percentage of human cells in the bone marrow of mice transplanted with four primary AML samples 1 week post treatment. The treatment started at HE (gray area). Each dot represents an individual mouse. AML5 UT n = 5; A+C n = 4; A+C+G n = 3; AML6 UT n = 5; A+C n = 6; A+C+G n = 5; AML7 UT n = 4; A+C n = 4; A+C+G n = 4; AML8 UT n = 3; A+C n = 4; A+C+G n = 3. Number of total mice = 50. c Percentage of human cells in the bone marrow of AML7-transplanted mice 1 week post treatment. d Remaining leukemic cells in the bone marrow of AML7-transplanted mice 1 week post treatment shown by hematoxilin & eosin (H&E, left panel) and immunofluorescence (right panel). Green cells are human CD45+, red cells are Ki67+, and nuclei are labelled blue. Scale bar is 100 micron for all images. Lower graph represents the ratio of cycling Ki67+CD45+ cells. e L-LTC-IC assay on hCD45+ cells pooled from AML7-injected mice 1 week post treatment. Cells were kept in vitro for 2 weeks in methylcellulose in a LDA assay. Linear regression with 95% confidence bands, (p value = 9.6−11. A+C n = 3; A+C+G n = 3). f Secondary transplantation of hCD45+ cells, pooled from AML8-injected mice 1 week post treatment. Each dot represents an individual mouse (A+C n = 3; A+C+G n = 3). g Percentage of human cells in the bone marrow of hBM-transplanted mice 1 week and eight weeks post treatment (UT n = 4; G n = 4). *p < 0.05 and ns = non-significant

