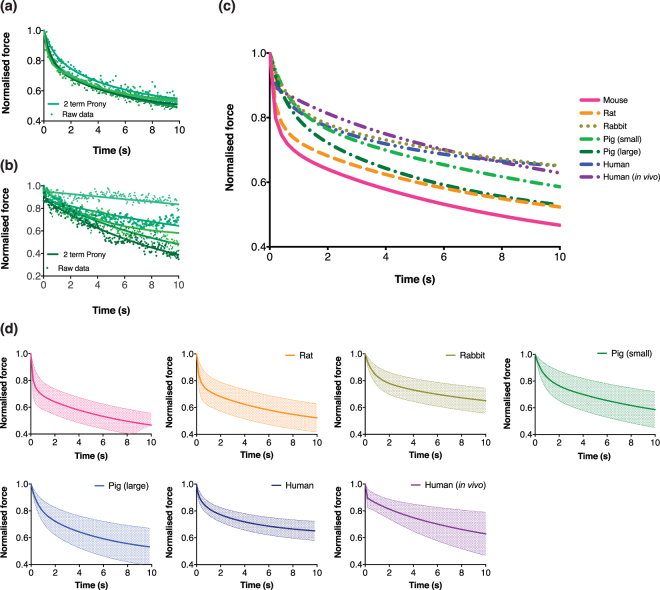
Figure 2.
(a) Representative examples of two-term Prony series fitted to raw data showing the spread of raw data and curve fits. (b) Representative example of fitted two-term Prony series on one set of human in vivo data illustrating noticeable oscillations caused by heartbeats and small body movements of volunteers (first 10 s shown). Curves were still able to fit to the raw data as shown. (c) Mean force-time response of skin during a step-load over the first ten seconds of all species. (d) Mean and SD of force-relaxation curves for each species shown individually.

