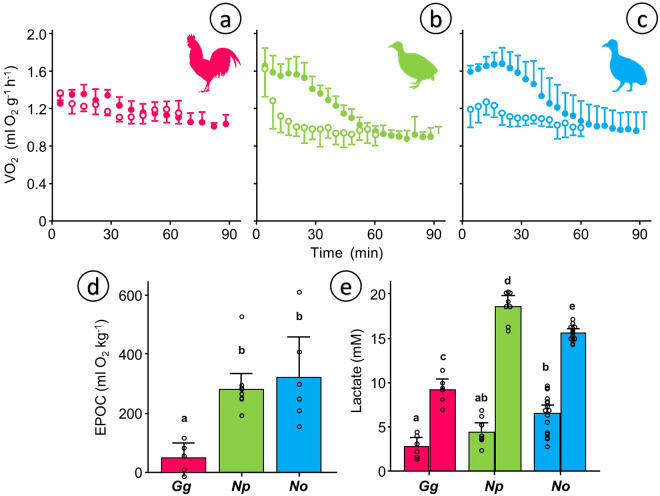
Figure 5.
Metabolic measurements before and after a 3 min chase-and-exhaust protocol. ABC) Mass-specific oxygen consumption (VO2) in adult individuals of (a) Red Junglefowl (Gallus gallus, Gg, N = 5), (b) Chilean Tinamou (Nothoprocta perdicaria, Np, N = 10) and (c) Ornate Tinamou (Nothoprocta ornata, No, N = 6). Open symbols show the data for the 60 min baseline measurements and closed symbols show the data for the 90 min following the chase protocol. (d) Excess post-exercise oxygen consumption (EPOC) obtained by integrating the pre- and post-curves shown as ABC. (e) Plasma lactate levels obtained using the same protocol in a separate group of individuals (Gg N = 6, Np N = 8, No N = 16). Data in A–C presented as mean and standard deviations. Data in D–E presented as mean and 95% confidence intervals with individual data points shown. For statistical analysis we used general linear modeling (GLM) considering species (D) and species/treatment (E) as factors followed by Tukey posthoc test with a customary fiduciary significant level of p < 0.05 (shown as dissimilar letters) in Minitab 17. No statistical analysis was performed for panels ABC because the integrated response is considered in panel (d).

