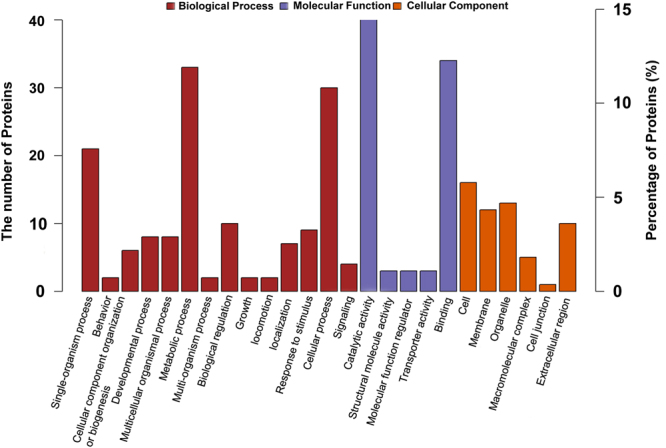
Figure 3.

Gene Ontology classifications of antennal differentially expressed proteins as identified by iTRAQ in the responsive and non-responsive Bactrocera dorsalis male files. The y-axis (left) represents the protein number, and the y-axis (right) represents the percentages of the proteins identified. The functional assignments to biological processes, molecular functions, and cellular components are shown from the number of proteins and corresponding proportion converted.
