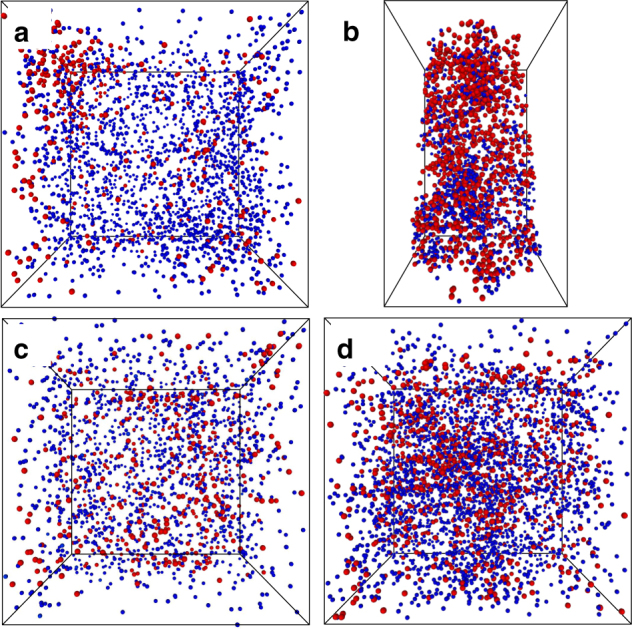
Fig. 4.

Selection of 3D atom probe tomography data for comparison. 20 × 20 × 20 nm3 cubic regions selected from each sample to give a closer comparison of the Cu (red) and Al (blue) distributions, with locations shown in Supplementary Fig. 21, and a schematic overview of these results is given in Fig. 1. a Fresh Cu-ZSM-5 (1), b aged Cu-ZSM-5 (3, the bounding box is 20 × 13 × 13 nm3 as this needle was smaller), c fresh Cu-SSZ-13 (4), and d aged Cu-SSZ-13 (7)
