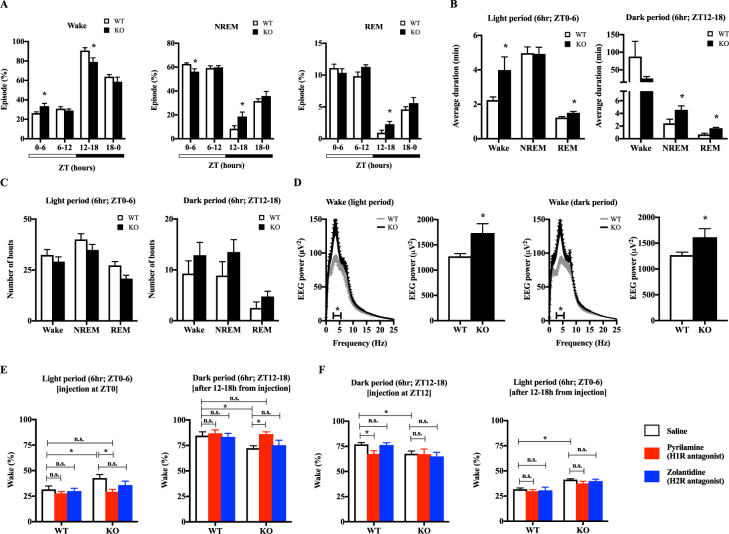
Figure 4.
Sleep-wake cycle abnormalities in Hnmt-deficient mice are driven by H1R activation. (A) The ratios of wakefulness, NREM sleep, and REM sleep on the indicated Zeitgeber time (ZT) periods (n = 8). Light period (white horizontal bar), ZT0-12; dark period (black horizontal bar), ZT12-0 (n = 8, Student’s t-test; *p < 0.05). White bars, wild type (WT); black bars, knockout (KO). (B) Average duration of bouts during ZT0–6 and ZT12–18 (n = 8) (Student’s t-test, *p < 0.05). (C) Number of bouts during ZT0-6 and ZT12-18 (n = 8). (D) The spectral distribution of cortical EEG power density during wakefulness in the light and dark periods. Grey line, WT; black line, KO. Horizontal bars indicate statistical differences between the WT and KO groups. Bar graphs show the total power of EEG between 3.0 and 5.5 Hz. White bar, WT; black bar KO. (n = 8) (Student’s t-test, *p < 0.05). (E) Effects of pyrilamine and zolantidine administration at ZT0 on wakefulness in WT and KO mice during ZT0-6 and ZT12-18. (F) Effects of pyrilamine and zolantidine administration at ZT12 on wakefulness in WT and KO mice during ZT12-18 and ZT0-6. White bar, saline; red bar, 10 mg/kg pyrilamine (H1R antagonist); blue bar, 10 mg/kg zolantidine (H2R antagonist) (n = 6–8) (two-way ANOVA with Bonferroni multiple comparisons test; *p < 0.05; n.s.: not significant).

