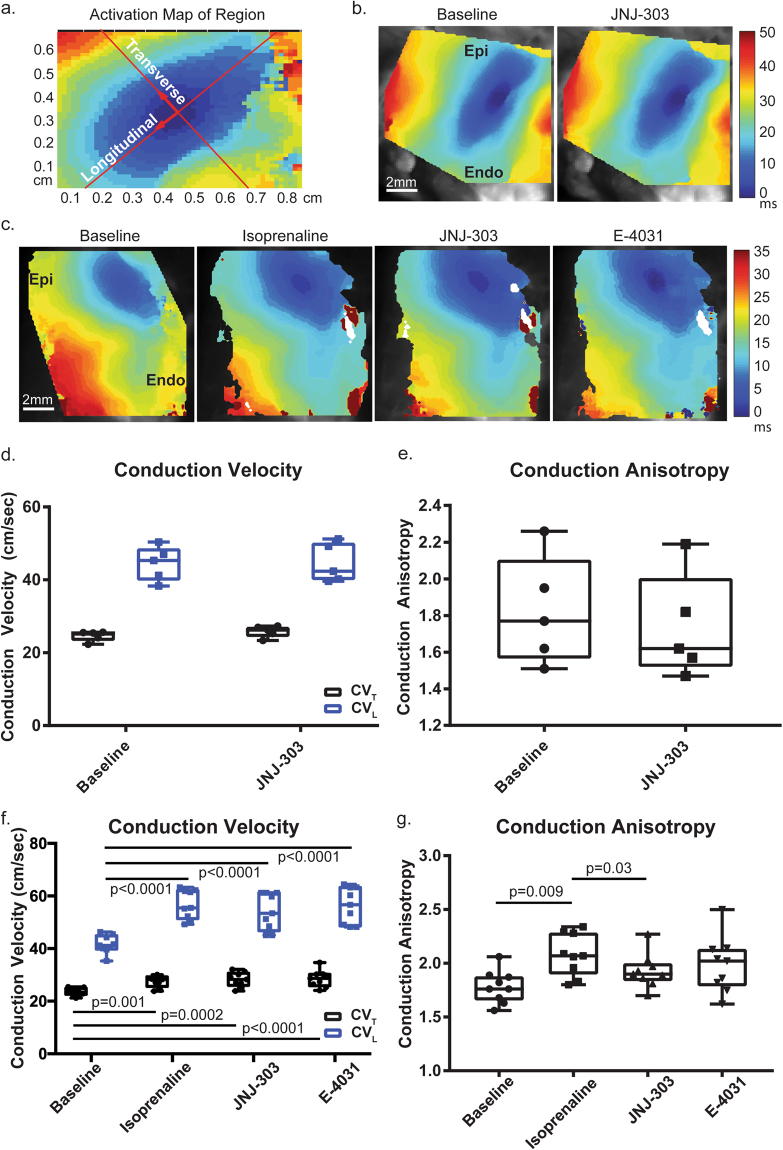
Figure 3.
Conduction Properties. Conduction velocity (CV) was calculated from the transmural surface of the preparation. (a) A typical elliptical activation pattern was observed. Directions of activation (longitudinal, transverse) indicate the fastest and slowest conduction, respectively. (b) A representative activation map from protocol B shows that the activation pattern was the same both before and after application of JNJ-303. (c) Representative activation maps from protocol C indicate that conduction was increased with the application of isoprenaline. This change in activation was maintained with the addition of JNJ-303 and E-4031. (d) No significant difference was observed between transverse and longitudinal conduction velocities (CVT, CVL) in protocol B, and the anisotropy ratio was not altered (d). (f) Both CVT and CVL increased significantly with isoprenaline, but no other significant changes from previous conditions were observed. However, significant differences to the baseline were apparent. (g) Conduction anisotropy increased with isoprenaline, slightly decreased with JNJ-303, and remained unchanged with E-4031.

