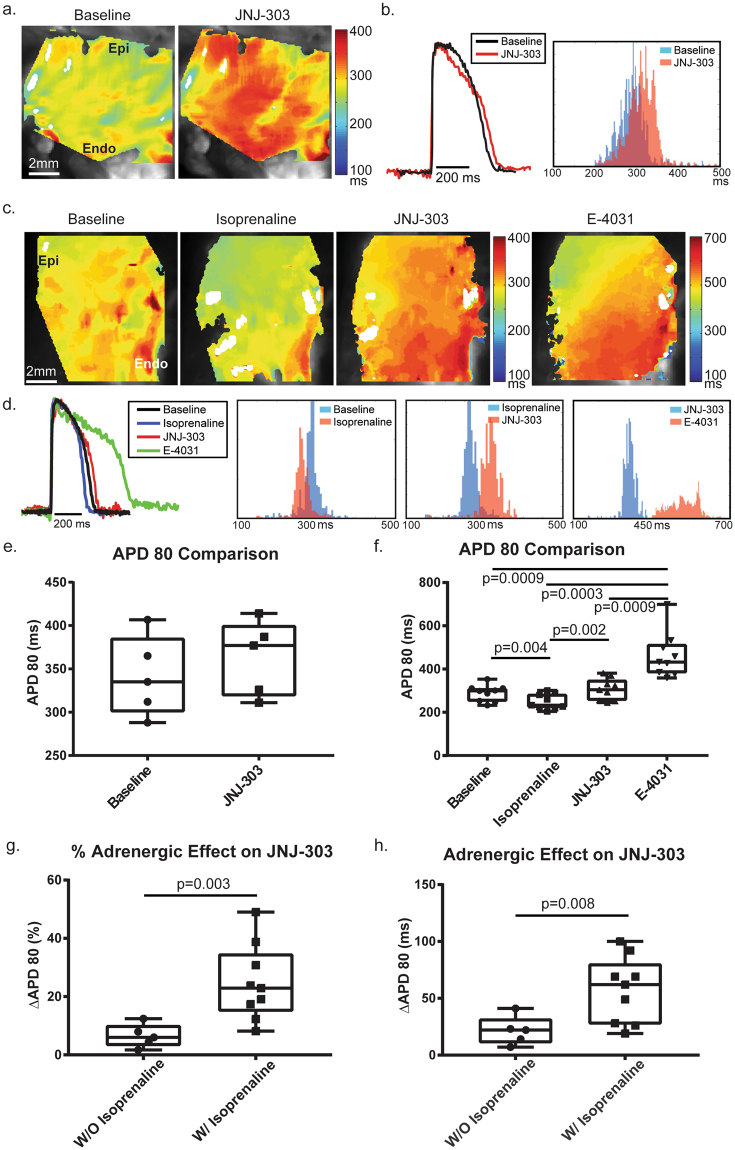
Figure 4.
APD80 Comparisons. APD was measured at 80% of repolarization. (a) APD80 maps for both conditions in protocol B show that JNJ-303 increased APD80 slightly (but not significantly), as indicated by the red color. (b) Representative traces show changes in APD80 distribution after application of JNJ-303. Blue indicates baseline and red indicates the pharmacologic intervention. (c) APD80 maps for all conditions in protocol C highlight that isoprenaline decreased APD80, JNJ-303 increased APD80 above baseline, and E-4031 dramatically increased APD80. (d) Representative traces for each condition in protocol C show distribution histograms for three pairs of comparisons: baseline vs. isoprenaline, isoprenaline vs. JNJ-303, and JNJ-303 vs. E-4031. Bars in blue are representative of previous treatment, while bars in red are representative of post treatment. (e) B&W plots indicate a slight but not significant increase in APD80 with IKs block. (f) Significant reduction of APD80 was observed with application of isoprenaline, and an increase of APD80 was observed with both IKs and IKr block. (g,h) ∆APD80 in both ms and % of pre and post JNJ-303 with or without isoprenaline stimulated β-ARs. ∆APD80 drastically increased in both cases. See text for details.

