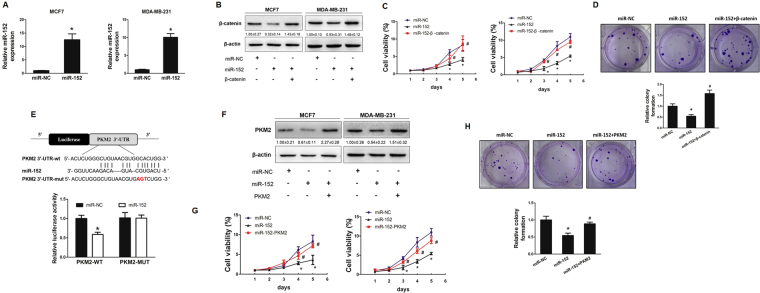
Figure 2.
MiR-152 repressed cell growth via inhibiting both β-catenin and PKM2. (A) MCF7 and MDA-MB-231 cell lines stably expressing miR-152 or miR-NC were established by lentiviral transduction. The expression level of miR-152 (normalized to U6) in MCF7 and MDA-MB-231 cells stably overexpressing miR-152 or negative control of miRNA (miR-NC) were analyzed by qRT-PCR. *Indicates p < 0.05 compared with miR-NC group. (B) These miR-NC or miR-152 stably expressing cells were transfected with β-catenin cDNA plasmid without 3′-UTR. After transfection for 24 hours, cells were screened in 800 μg/ml G418 for a week. Total proteins were collected, then β-catenin and β-actin levels were determined by Immunoblotting assay. (C) CCK8 proliferation assay was performed every 24 hours (left: MCF7 cells; right: MDA-MB-231 cells). *p < 0.05. (D) Colony formation assay was performed using the stable MCF7 cells as described above. Cells were incubated for 14 days and the representative colonies were shown in the upper panel. (E) The wild type (WT) and mutated (Mut) reporter constructs of PKM2 3′-UTR sequences is shown. Relative luciferase activities of WT and Mut PKM2 reporters were detected by using Luciferase reporter assay. (F) PKM2 cDNA plasmid without 3′-UTR was transfected into miR-152 stably expressing cells as described above. Total proteins were collected and PKM2 levels were measured using Immunoblotting assay. (G) Cell viability was determined in MCF7 (left) and MDA-MB-231 (right) cells stably expressing miR-152 with or without PKM2 cDNA transfection, respectively. *Indicates p < 0.05 when compared to miR-NC group; #indicates p < 0.05 when compared to miR-152 overexpression group. (H) Colony formation was tested using cells above. *Indicates p < 0.05 when compared to miR-NC group. #Indicates p < 0.05 when compared to miR-152 overexpression group.

