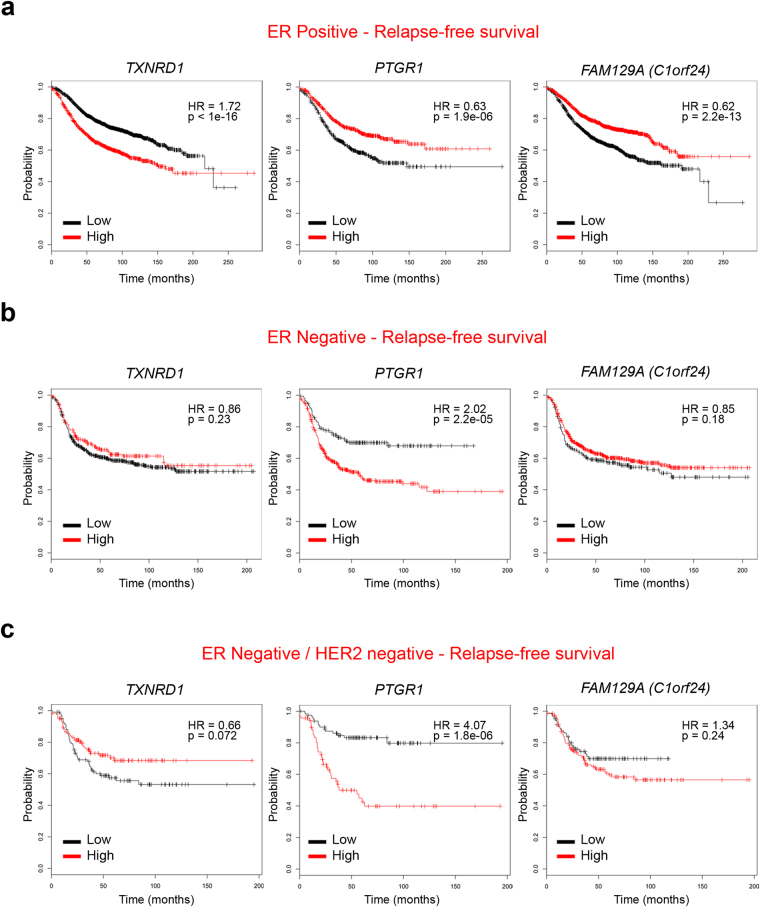
Figure 4.
Survival analysis with identified miR-500a-5p targets (KM Plotter dataset). The breast cancer dataset from Kaplan Meier Plotter (Gyorffy B. et al.) was used to test for survival prediction capacity of miR-500a-5p oxidative stress targets (Table 1) in ER+ (a) ER− (b), and ER−/HER2− (c) breast cancer samples. Cox regression model was used for each gene to predict relapse-free survival. The three most significant associations (lowest p values) are shown (remaining four associations are shown in Fig. S1). Samples are divided into Low (black) and High (red) expression groups for each gene. Hazard ratio (HR) and P value for each association are shown within each plot.

