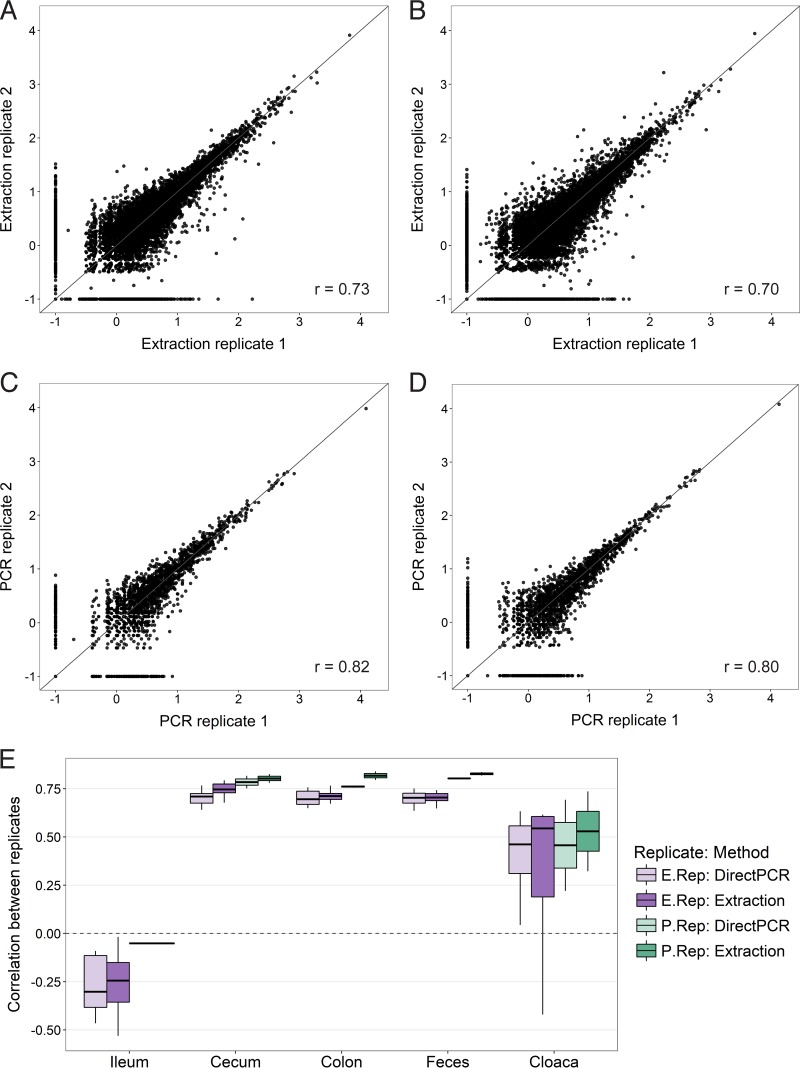
FIG 6 .
Repeatability of OTU abundances between replicate samples. Scatterplots show abundances of all OTUs in extraction replicates obtained with the DNA extraction method (A), extraction replicates obtained with the direct PCR method (B), PCR replicates obtained with the DNA extraction method (C), and PCR replicates obtained with the direct PCR method (D). OTU abundances have been normalized in accordance with the DESeq2 method and log transformed (+0.1) for graphical purposes. r values are Spearman rank correlation coefficients. (E) Box plot of correlation coefficients (Spearman rank correlation) of OTU abundances calculated separately for all 100 replicate sample pairs.

