FIG 2 .

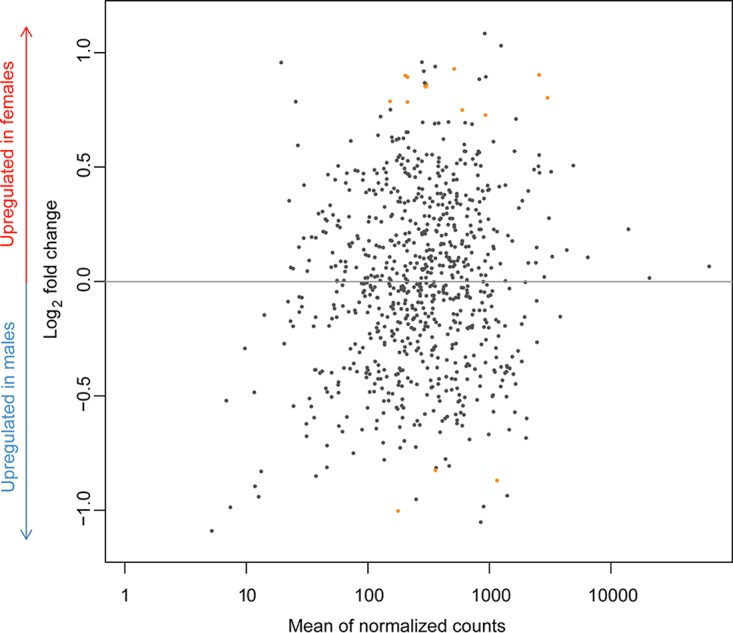
Normalized mean transcription values of cEper1 chromosomal and plasmid genes are plotted against log2 fold change values for each gene. Differentially expressed (DE) genes are highlighted in orange.

Normalized mean transcription values of cEper1 chromosomal and plasmid genes are plotted against log2 fold change values for each gene. Differentially expressed (DE) genes are highlighted in orange.