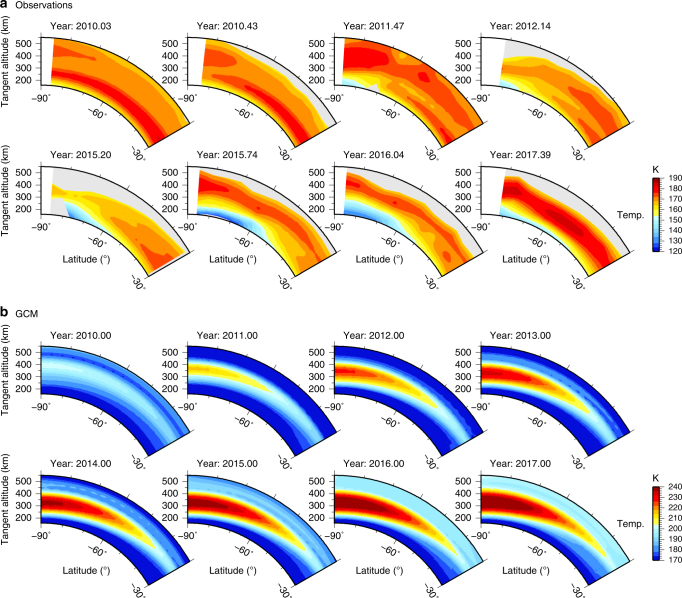
Fig. 3.
South-polar vortex temperature evolution. a Temperature cross-sections derived from Cassini CIRS 14 cm−1 limb mapping observations. Grey areas indicate where signal-to-noise is too low to allow a reliable temperature determination. Observations clearly show development of an initial mesospheric hot-spot over the south pole at 400 km due to adiabatic heating, followed by a rapid cooling in 2012 which lasts for 4 years, and finally a returning hot-spot in late-2015. b Predictions from a general circulation model (GCM)17 during the same period do not show the disappearance of the polar hot-spot. Note that the observations do not cover 2013 and 2014 due to orbital viewing constraints

