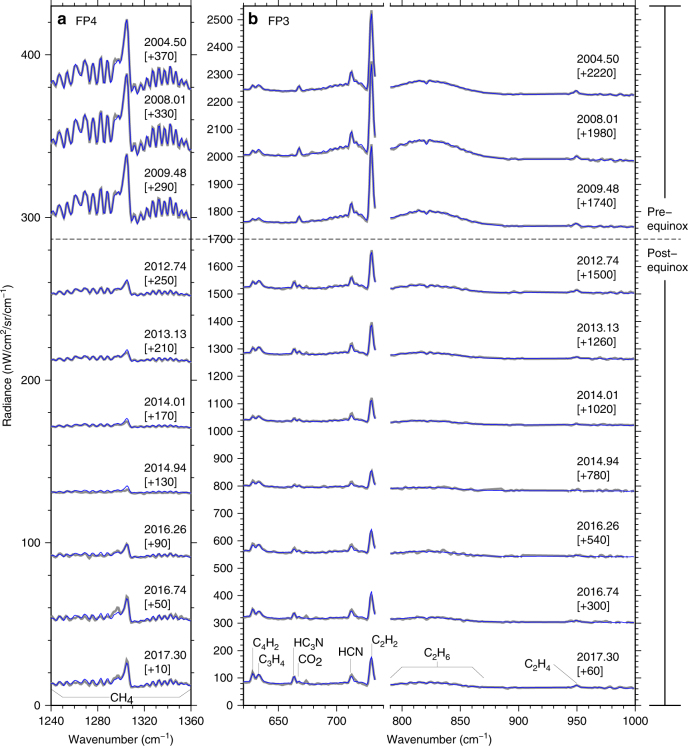
Fig. 5.
Evolution of Cassini CIRS nadir spectra of the south polar vortex. a FP4 spectra of the ν 4 methane band, sensitive to stratospheric/mesospheric temperature. Pre equinox spectra show high emission and have a corresponding high temperature, whereas post-equinox spectra show minimal ν 4 emission, indicating very cold stratospheric/mesospheric temperatures. From 2016 ν 4 emission begins to increase indicating a return to a warm polar state. b FP3 spectra of trace gas emission peaks (labelled). Moderate trace gas emission enhancement is evident in the post-equinox spectra. For example, the HC3N peak is more prominent from late 2012 onwards, despite the cold temperature prevalent at that time. All data were measured at 80°S. Blue lines show fits and grey lines with 1-σ error envelopes show measured spectra. All data are fitted to within measurement uncertainty. Spectra are offset in radiance for clarity by the amount shown in square brackets

