
Fig. 2.
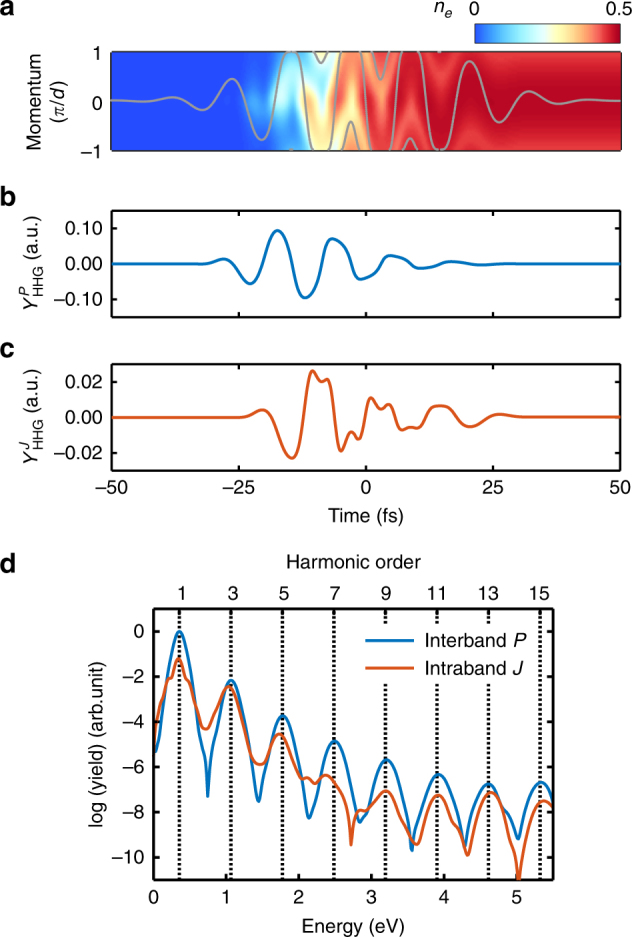
Simulation of HHG from a single mid-infrared pulse. a The evolution of electron population in the conduction band. The population oscillates in momentum space, corresponding to the intraband transition. The gray line shows the classical motion of a conduction electron driven by the laser field. The alternative increase and decrease of the population in a sub-laser-cycle period along the gray line is given by the interband transition. b Time-dependent harmonic yield in atomic units (a.u.) from the interband contribution (polarization). c Time-dependent harmonic yield from the intraband contribution (current). d High-harmonic energy spectra from the interband (blue) and intraband (red) transitions by Fourier-transforming (b, c), respectively