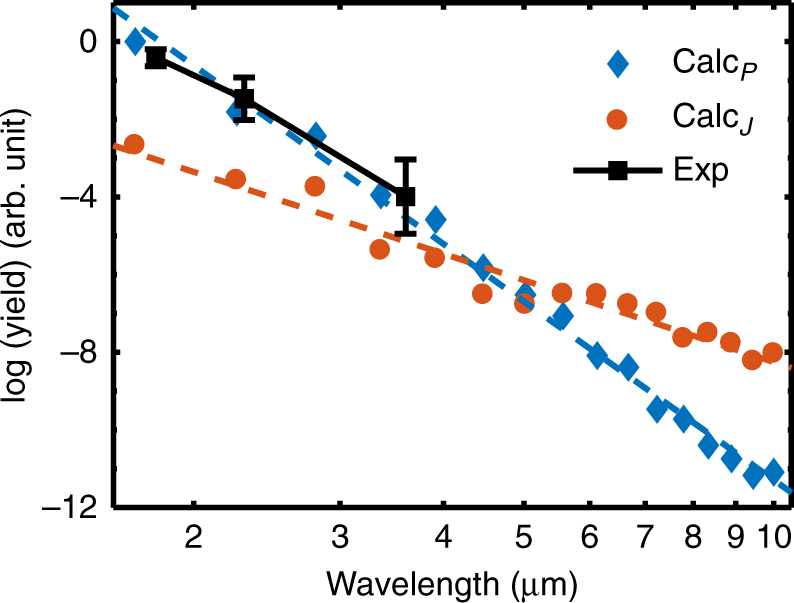
Fig. 4.

Wavelength dependence of HHG yield. The calculated yield (integrated over 2.0–4.0 eV) from either the interband transition (blue diamonds) or the intraband transition (red dots) decreases monotonically. A fitted slope of λ −(15.3 ± 0.8) from the interband polarization is steeper than the fitted slope of λ −(7.0 ± 0.9) from the intraband current. At longer wavelengths, the contribution from the intraband transition exceeds that from the interband transition (Supplementary Fig. 5). Our experimental measurement (black squares) (Supplementary Fig. 6) covers the mid-infrared range where the interband contribution dominates. The fitted slope of λ −(11.4 ± 2.9) from the experiment (black squares) matches the calculation well, and is much steeper than the well-established atomic case28,29. The error bars in the figure are estimated according to the variation of focal sizes and pulse durations at each wavelength
