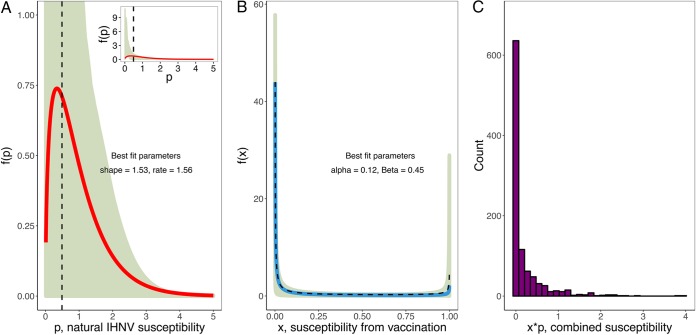
FIG 2 .
Estimated IHNV susceptibility distributions from models in Fig. 1. Solid lines show estimated distributions allowing heterogeneity in unvaccinated and vaccinated fish. Dashed lines show model fits allowing heterogeneity in the vaccine group only, with homogeneous controls. (A) Gamma-distributed susceptibility (microliters per PFU-hour) of unvaccinated fish challenged with IHNV. (Inset) Estimated gamma distribution showing full confidence interval range. (B) Beta-distributed susceptibility multiplier of vaccination, obtained under the assumption that a vaccinated fish’s susceptibility was the product of a random draw from the gamma distribution obtained from unvaccinated fish, multiplied by an independent random draw from this beta distribution. We obtained 95% confidence regions by bootstrapping chi-squared residuals to create 1,000 pseudoreplicates of infection data and then refitting the model to pseudoreplicates to determine the 95% confidence regions of parameters as described in reference 18. The dashed curve, almost indistinguishable from the solid blue one, is the pure beta distribution under the assumption of heterogeneity only in vaccinated hosts. (C) Histogram of the product of 1,000 random draws from a beta distribution multiplied by 1,000 random draws from a gamma distribution with parameters defined by distributions (colored lines) in panels B and C.

