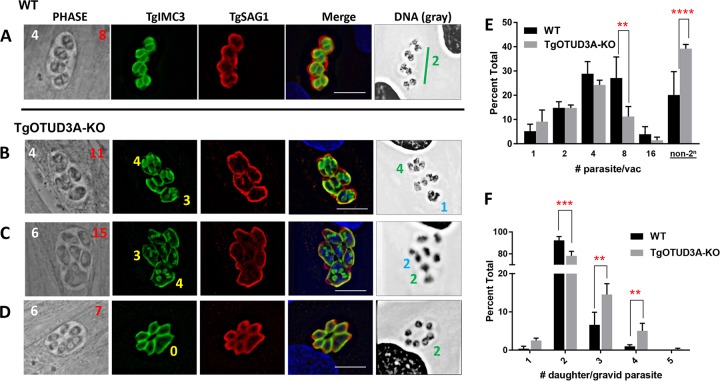
FIG 2 .
TgOTUD3A-KO parasites exhibit a range of altered/aberrant endodyogeny phenotypes. WT and TgOTUD3A-KO parasites in HFFs were fixed at 24 h postinfection and labeled with rat anti-TgIMC3 and rabbit anti-TgSAG1 antibodies. Nuclear DNA was labeled with Hoechst dye. The DNA images were converted into gray scale for better visualization. Phase images show parasite morphology, with total numbers of parasites (white numbers) and of mature/immature daughter scaffolds (red numbers) per vacuole indicated. (A) Wild-type parasites exhibit synchronous 2n replication as determined by the number of daughter scaffolds (TgIMC3, green) in each replicating parasite (TgSAG1, red), representing normal endodyogeny. (B and C) The replication phenotypes in TgOTUD3A-KO parasites are often altered with regard to the total number (non-2n) of parasites within vacuoles, the numbers of daughter scaffolds within individual mothers, the numbers of nuclei, and the nuclear morphology. In each case presented where daughter scaffolds are present, aberrant and normal endodyogeny are evident within the same vacuole. In the DNA images, symmetrical nuclear division is indicated with green numbers, while polyploid and asymmetrical nuclei within individual parasites are marked with blue numbers. In the Phase and TgSAG1 images, note that mother parasites containing 3 or 4 TgIMC3-positive (yellow numbers in TgIMC3 images) daughter scaffolds tend to be enlarged and morphologically distinct relative to mother parasites that are undergoing normal endodyogeny. In the case of multiple daughters, all the daughter scaffolds within a given mother were found to be of equal size. (D) Evidence of mitosis (nuclei marked with green 2 in DNA image) in the absence of linked cytokinesis suggests a disconnect between nuclear and budding cycles. (A to D) Scale bars = 10 µm. (E) Quantification of aberrant replication. Parasitophorous vacuoles (PV) were labeled with the PV marker mouse anti-TgGRA3 antibody, while individual parasites were identified using the surface marker rabbit anti-TgSAG1 antibody. All slides were coded, and the numbers of parasites per vacuole (2n [1, 2, 4, 8, and 16] versus non-2n) were counted blindly by three individuals. A total of 4 biological replicates with 3 independent samples per replicate were counted. One-way ANOVA indicated that there was a significant difference (F11,36 = P < 0.0001) between the wild-type and TgOTUD3A-KO lines with regard to the incidence of deviation from a 2n progression that manifests following the first 2 rounds of replication. A total of 1,649 vacuoles (WT = 756 and KO = 893) were counted for this analysis. (F) Comparison between numbers of daughter scaffolds (TgIMC3, green) per gravid parasite (TgSAG1, red) counted blindly in both wild-type and TgOTUD3A-KO parasites reveals that a significantly higher proportion of gravid mother parasites bear >2 progeny in the TgOTUD3A-KO than in the parental (WT) line. Analysis was restricted to parasites that contained daughter scaffolds (TgIMC3 positive). One-way ANOVA indicated significant differences (F9,25 = 761.8, P < 0.0001) between wild-type and KO parasites. (E and F) Tukey’s pairwise multiple-comparison test (α = 0.05) was used to compare the level of significance for comparison between wild-type and KO parasites for each group analyzed. Significant differences (P ≤ 0.05) are indicated by asterisks as follows: **, P ≤ 0.01; ***, P ≤ 0.001; ****, P ≤ 0.0001. A total of 2,059 (WT = 980, KO = 1,079) gravid parasites were counted in this analysis. Error bars represent standard deviations of the means.

