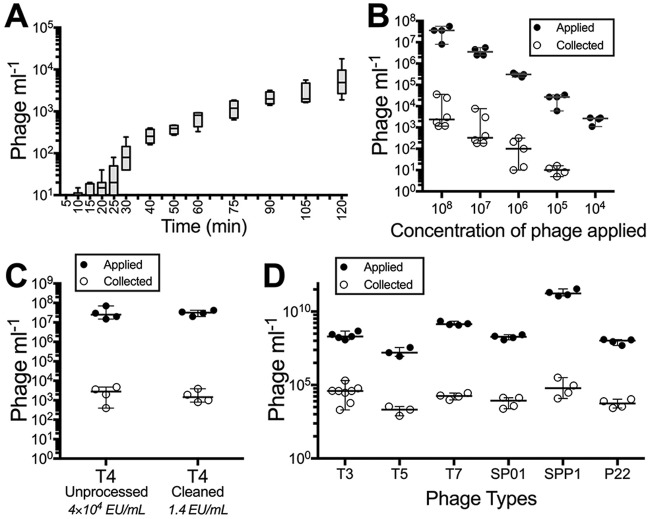
FIG 2 .
Rate of apical-to-basal phage transcytosis across diverse phages. (A) Rate of T4 phage transcytosis across MDCK cells over a 2 h period. (B) Transcytosis of T4 phage applied to MDCK cells at sequentially decreasing log10 concentrations. (C) Transcytosis of unprocessed (4 × 10⁴ endotoxin units [EU] ml−1) and cleaned (1.4 EU ml−1) T4 phages across MDCK cells. (D) Transcytosis of diverse phage types (T3, T5, T7, SP01, SPP1, and P22 phages) across MDCK cells. Bar plot shows mean; error bars show minimum and maximum values. Scatter plots show medians; error bars represent 95% confidence intervals; each point represents the average from two technical replicates.

