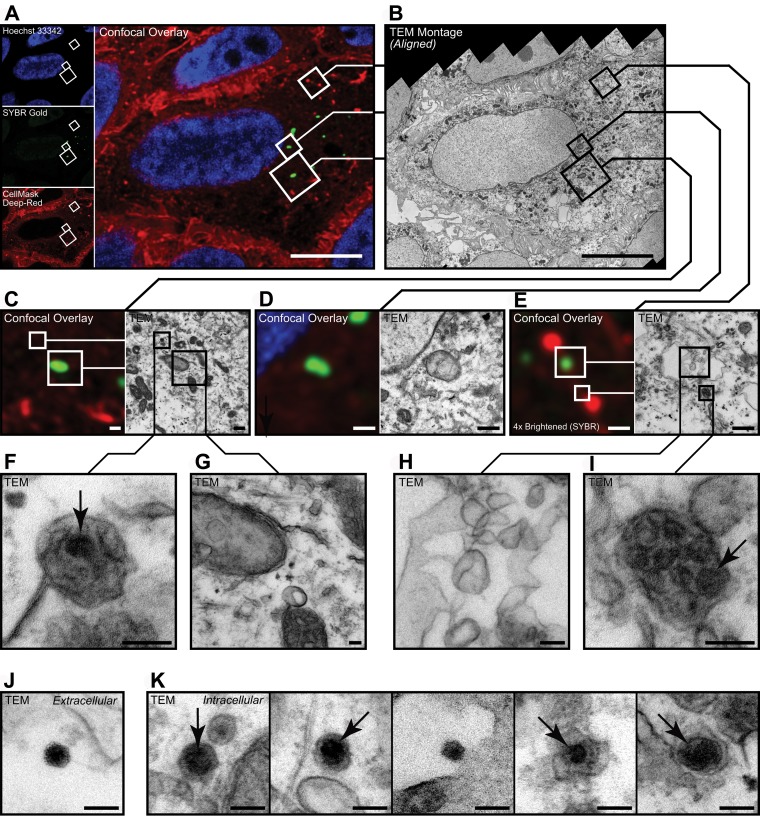
FIG 4 .
Visualization of intracellular phages. (A to I) Representative correlative micrographs of an MDCK cell stained with Hoechst stain (blue) and CellMask (red) after application of T4 phages stained with SYBR gold (green). (A and B) SYBR gold-positive target cell was selected during confocal microscopy (A) and then processed and aligned for inspection of the same structures by transmission electron microscopy (TEM) (B). (C to I) Spatially aligned electron micrographs showing SYBR gold-positive endomembrane structures (G and H), adjacent to SYBR gold-negative virus particles (F and I). (J and K) Representative electron micrographs of extracellular (J) and intracellular (K) virus particles found in CLEM samples. Data in panel A are maximum projection between the 37th and 43rd optical sections (3.0 µm to 4.2 µm above coverslip surface). Data in panel B are a distortion-corrected TEM montage from the 47th resin section (3,670-nm sample depth, 85 nm thick) acquired at 25 kx. Arrows indicate virus-like particles within membrane-bound vesicles. Data used for spatial alignment are shown in Fig. S2. Bars, 10 µm (A and B), 500 nm (C to E), and 100 nm (F to K).

