
Figure 1.
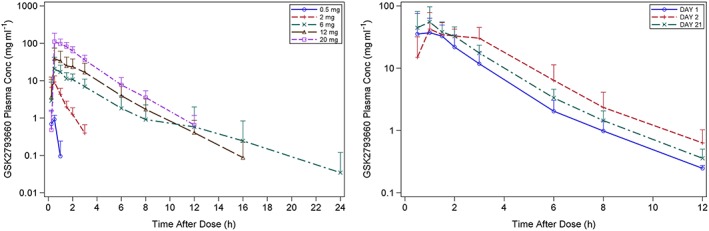
Plasma concentration time profiles of GSK2793660 following single doses (left) and repeat doses (right) of GSK2793660. Data are expressed as mean concentrations ± 95% confidence intervals on a semilogarithmic scale
Official websites use .gov
A
.gov website belongs to an official
government organization in the United States.
Secure .gov websites use HTTPS
A lock (
) or https:// means you've safely
connected to the .gov website. Share sensitive
information only on official, secure websites.
Plasma concentration time profiles of GSK2793660 following single doses (left) and repeat doses (right) of GSK2793660. Data are expressed as mean concentrations ± 95% confidence intervals on a semilogarithmic scale