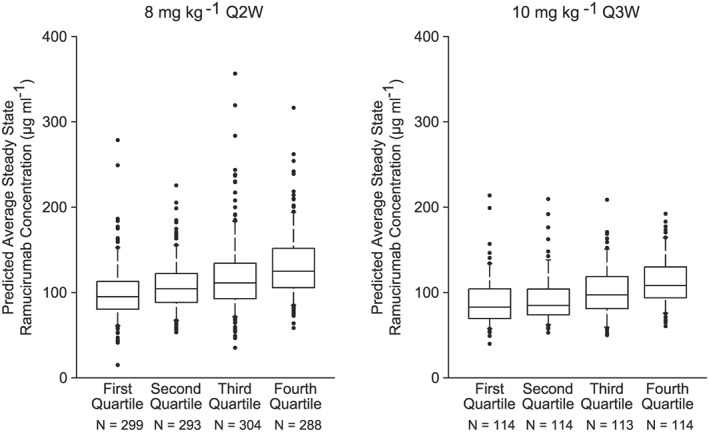
Figure 5.

Box plots of predicted average steady‐state ramucirumab concentration (μg ml−1) stratified by baseline body weight (quartile). Box plots depict the 5th, 25th, 50th, 75th, and 95th percentiles
| 8‐mg kg −1 Q2W group: | 10‐mg kg −1 Q3W group: |
|---|---|
| First quartile: ≤57.4 kg | First quartile: ≤63.7 kg |
| Second quartile: >57.4 – ≤66.4 kg | Second quartile: >63.7 – ≤73.5 kg |
| Third quartile: >66.4 – ≤78.0 kg | Third quartile: >73.5 – ≤84.4 kg |
| Fourth quartile: >78.0 kg | Fourth quartile: >84.4 kg |
