
Figure 1.
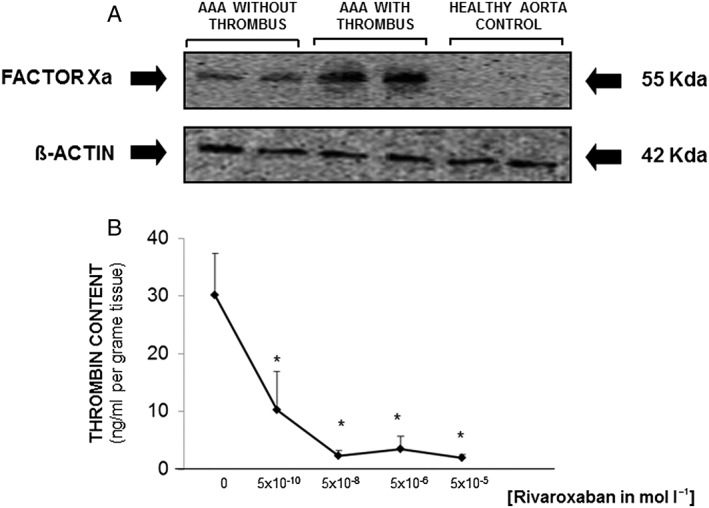
(A) Representative western blot showing FXa expression in two control aortic samples and in two aortic abdominal aneurysmal sites (AAA) with and two without intraluminal thrombus. The expression of β‐actin was used as loading control. (B) Dose–response curve of rivaroxaban based on thrombin content in three different aortic explants. Results are expressed as mean + standard error of the mean. *P<0.05 with respect to AAA without rivaroxaban