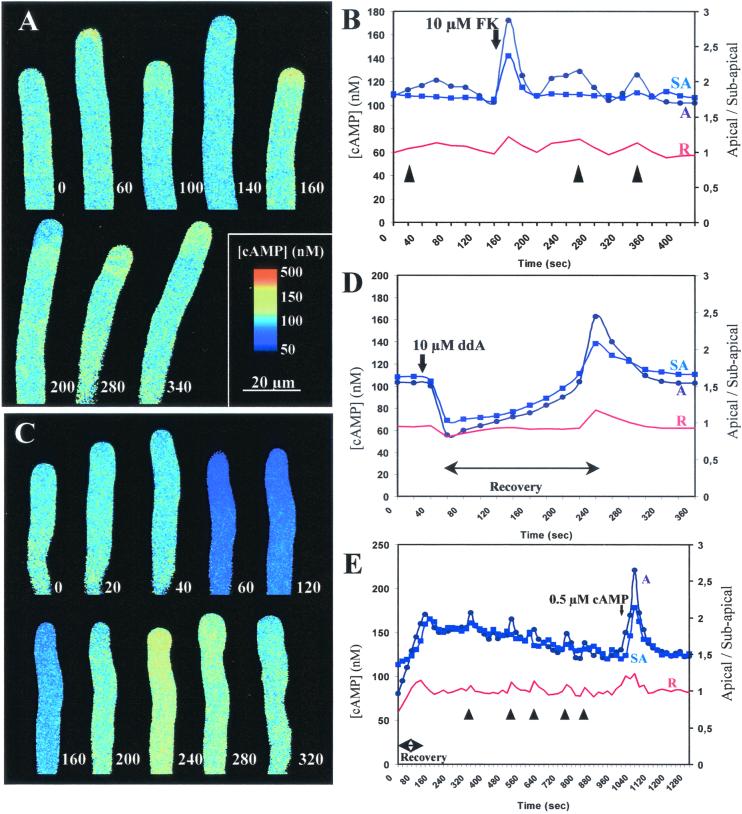
Figure 2.
Confocal time course ratio imaging of [cAMP]i. (A) Effect of 10 μM forskolin (FK) added at second 50. The times (seconds) at which images were taken are shown adjacent to the tip of the growing tube. The images are displayed with the color coding discussed next. (B) Plot of data in A. [cAMP]i in apical (A-●) and subapical (SA-■) regions. Equivalent data were obtained in four independent experiments. Red trace represents the ratio A/SA, and times at which pollen tubes changed growth direction are indicated by arrowheads. (C) Effect of 100 μM 2′,5′-dideoxyadenosine (ddA) added at second 30. (D) Plot of data in C. Equivalent data were obtained in four independent experiments. Symbols as in B. (E) Plot of data of a recovering pollen tube (0–120 sec) treated with 0.5 μM dibutyryl cAMP at sec 1,000. Equivalent data were obtained in six independent experiments. Symbols as in B.

