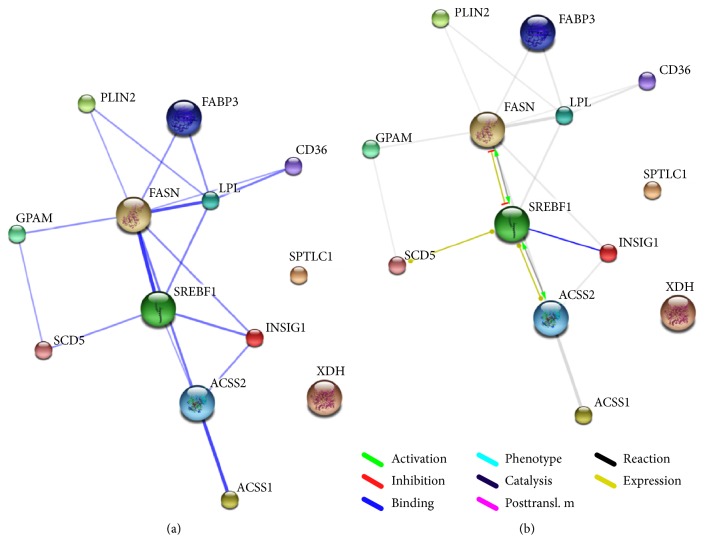
Figure 3.
Interaction network of overexpressed genes. STRING v9.1 was also used to map the interaction networks between the genes that appeared to be overexpressed based on transcript abundance studies. In (a), the weight of the edges represents the confidence of the interaction; the nature of these interactions has been shown in (b). SPTLC1 and XDH did not interact with any other gene of the 11 genes.

