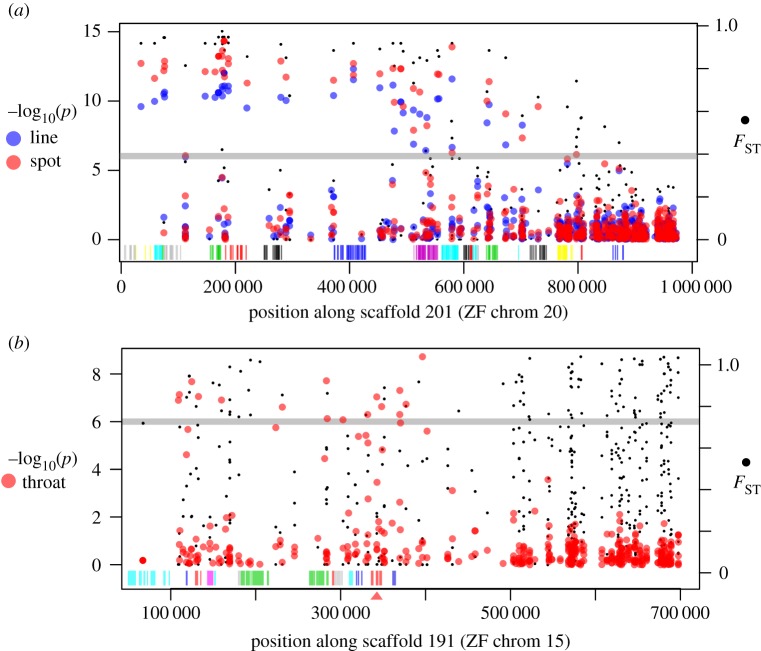
Figure 3.
Patterns of divergence and associations. (a) Phenotype–genotype associations for eye line (blue points) and eye spot (red points) for a region aligning to the zebra finch chromosome 20. Associations between these two traits are highly correlated with each other as well as patterns of divergence as measured by FST (filled black points). Strings of coding regions for genes are shown by the vertical bars, with different genes coloured arbitrarily, and different colours between adjacent genes. (b) Association with throat coloration (red points) in a region aligning to the zebra finch chromosome 15, in this case only associated with part of the FST peak. This region includes SCARF2 (exons shown in vertical red bars at 350 kb highlighted by the red triangle), a strong candidate gene for selective carotenoid transport. (Online version in colour.)

