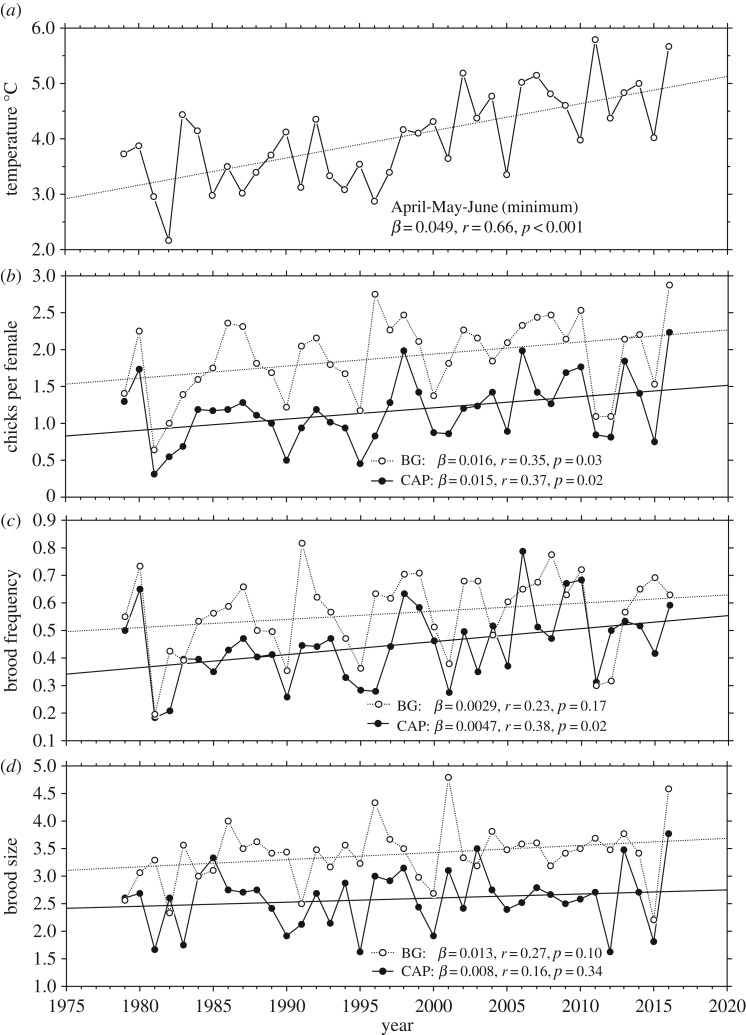
Figure 1.
(a) April–June averages of minimum daily temperatures, (b) breeding success (chicks per female), (c) brood frequency (females with broods), and (d) brood size in capercaillie (CAP) and black grouse (BG) during 1979–2016. Trend lines are ordinary least squares (OLS)-fitted regression lines, with accompanying slopes (β) and correlation coefficients (r).

