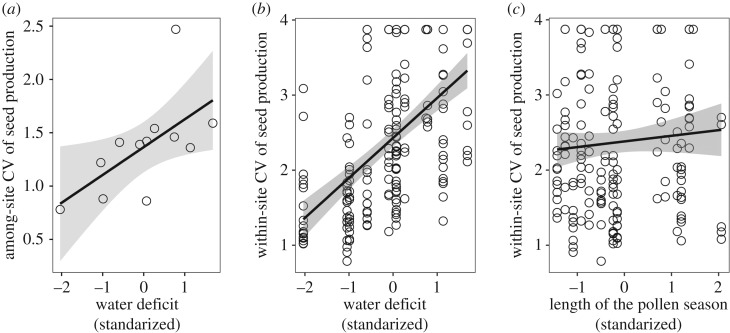
Figure 3.
The relationship between within-year seed production variability (CV) of holm oaks and the spring water deficit (a,b) and phenological synchrony (c). Trend lines are based on the linear regression (a) and GLMM (b,c), shaded regions represent associated 95% confidence intervals. Points represent measures of CV among sites (a) and among trees within sites (b,c), all within years. Note that the apparent poor fit of the line in (c) is because plots show the raw data, while the model accounts for the spring water deficit and the random effect of study site.

