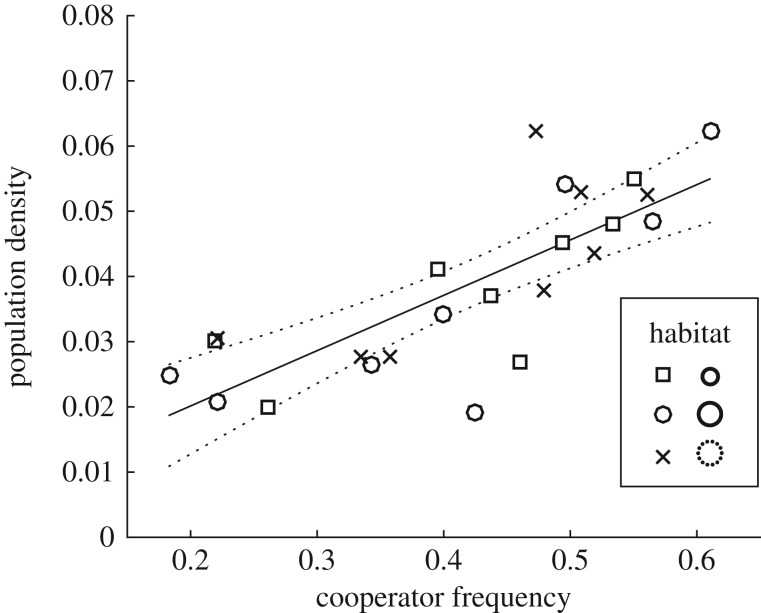
Figure 2.
Cooperator frequencies versus total population densities in different habitat type (n = 8 each). Symbols represent different habitats (legend). The relationship was positive (slope = 0.085, s.e. = 0.014, F2,22 = 36, p = 5.1 × 10⁻⁶, R2 = 0.62). The dotted lines represent the 95% confidence bounds. MANOVA shows that habitat type did not significantly affect cooperator frequencies and population densities (χ2(4,n = 24) = 0.93, Wilk's Λ = 0.96, p = 0.92).

