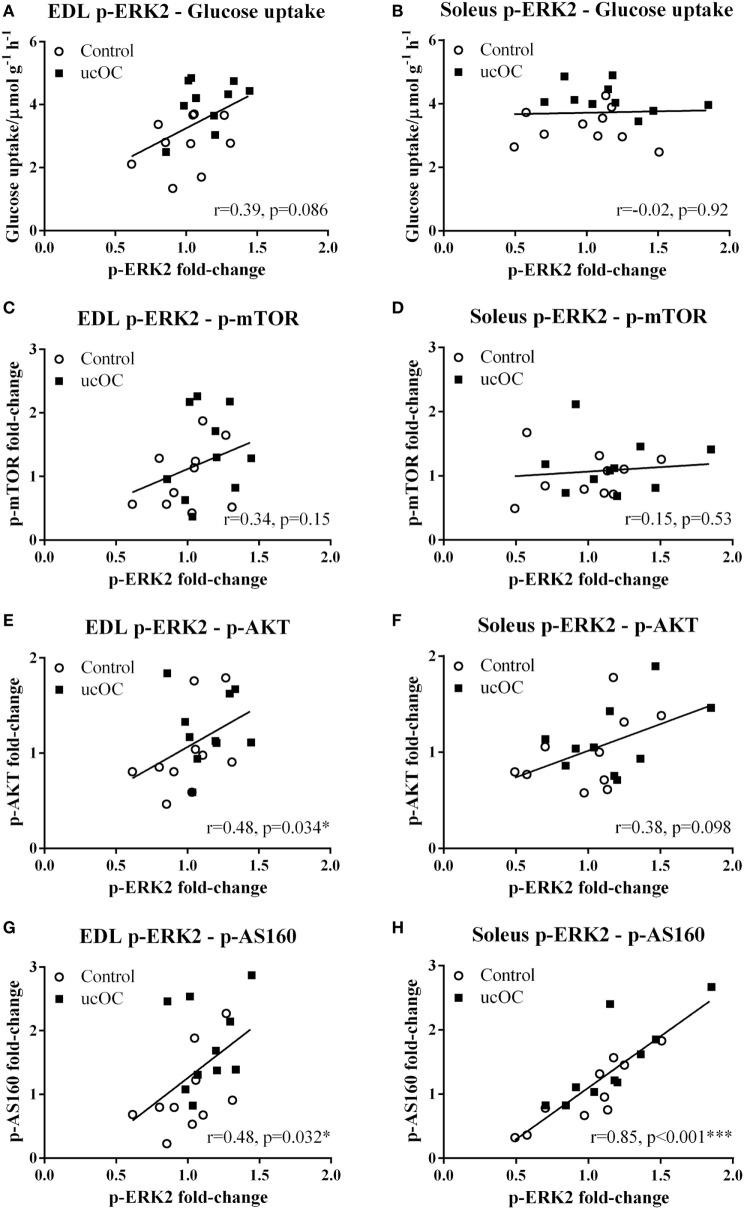
Figure 4.
The correlations between the levels of p-ERK2 and the levels of glucose uptake, p-mTOR, p-AKT, and p-AS160. In extensor digitorum longus (EDL) and soleus samples, the correlations between the levels p-ERK2 fold-change and the levels of glucose uptake (A,B), p-mTOR fold-change (C,D), p-AKT fold-change (E,F), and p-AS160 fold-change (G,H) were analyzed among samples from 30 ng mL−1 undercarboxylated osteocalcin (ucOC) treatment group; *P ≤ 0.05 and ***P ≤ 0.001.

