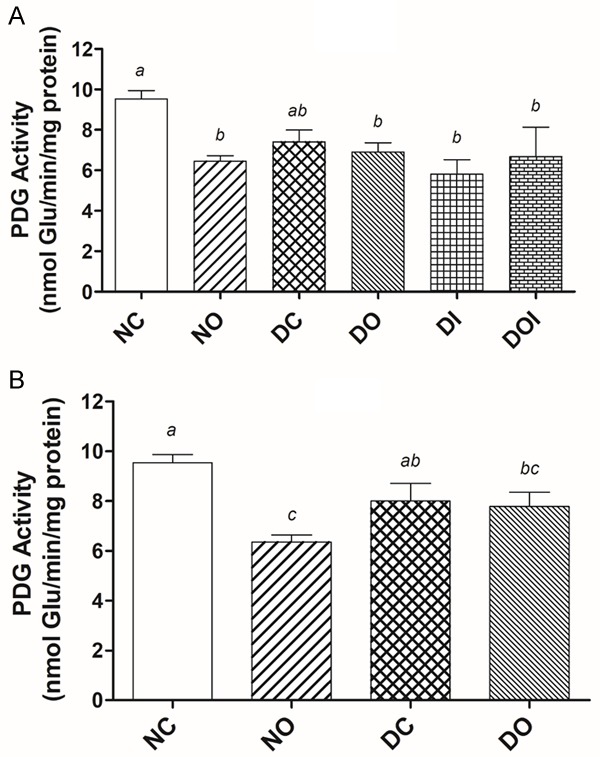
Figure 2.

The effect of diabetes and different treatments on the activity of phosphate dependent glutaminase (PDG) in the rat jejunum in high dose STZ-induced diabetes, (A) and low dose STZ-induced diabetes, (B) Glu = glutamate; NC = non-diabetic control; NO = non-diabetic OA treated; DC = diabetic control; DO = diabetic OA treated; DI = diabetic insulin treated; DOI = diabetic OA + insulin treated. Results are expressed as means ± SD (n = 6). Different alphabets (a, b, c) on bars indicates significant (P<0.05) difference from other groups.
