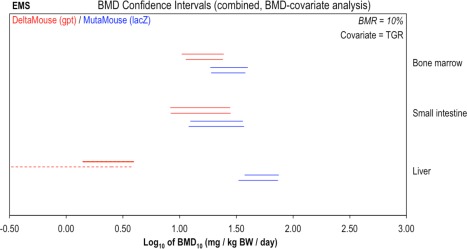
Figure 2.

Genotoxic potency of ethyl methanesulphonate (EMS) determined using the gpt delta Mouse (red) and Muta™Mouse (blue) transgenic rodent assays. BMD analyses, with TGR as covariate, were conducted to compare potency values (i.e., BMDs) determined using two different TGR assay variants. Two‐sided 90% confidence intervals of the BMD10 (i.e., BMR = 10%) were calculated from mutant frequency (MF) dose‐response data (i.e., gpt or lacZ MF) for bone marrow, small intestine, and liver tissues using two different BMD models: the exponential (upper interval per pair) or the Hill (lower interval per pair). Combined analyses were performed, two datasets at a time by tissue, using TGR as covariate. The dashed liver interval for the Hill model indicates an unbounded lower confidence limit (i.e., BMDL = 0). The underlying dose‐response data and fitted BMD models are presented in Supporting Information Figure S1.
