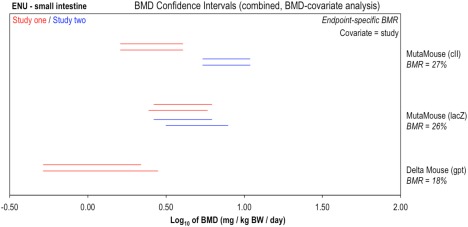
Figure 4.

Genotoxic potency analysis of N‐ethyl‐N‐nitrosourea (ENU) determined using the Muta™Mouse (cII or lacZ transgenes) or gpt delta Mouse (gpt transgene) transgenic rodent assays. BMD analysis, with endpoint‐specific BMR values, was conducted to compare BMDs determined using two TGR assay variants. Two‐sided 90% confidence intervals of the BMD, based on BMRs indicated beneath each tissue, were calculated from mutant frequency (MF) dose‐response data (i.e., gpt or lacZ transgene) for bone marrow, small intestine, and liver tissues using two different BMD models: the exponential (upper interval per pair) or the Hill (lower interval per pair). Combined analyses were performed, two datasets at a time by tissue, using study as covariate. The underlying dose‐response data and fitted BMD models are presented in Supporting Information Figure S3.
