
Figure 1.
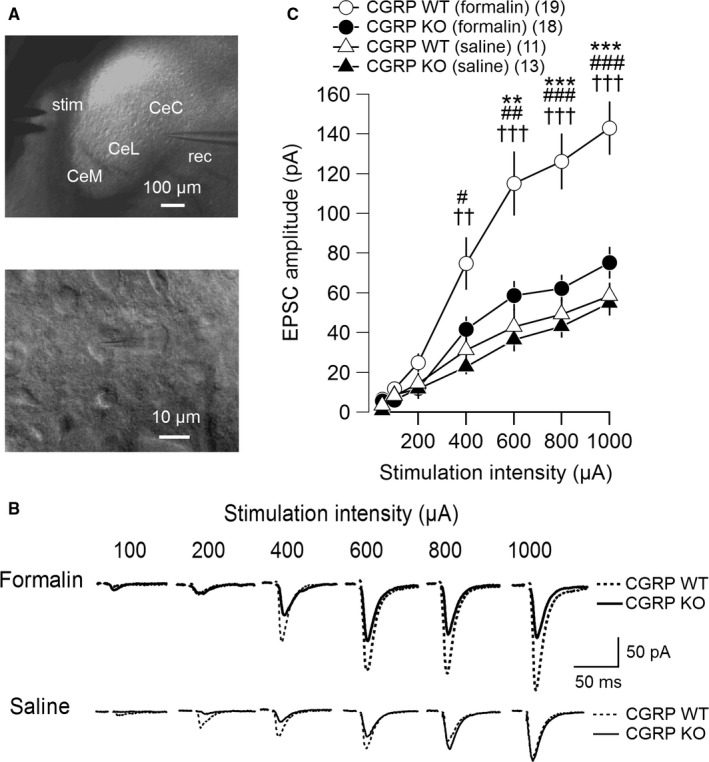
Excitatory postsynaptic currents (EPSCs) evoked at parabrachial (PB)–laterocapsular region of the central amygdala (CeC) synapses in the right amygdala 6 h after intraplantar formalin injection. (A) Micrographs showing the locations of the stimulation and recording electrodes in the central amygdala (CeA) (top) and a representative CeC neuron being recorded (bottom). rec, patch‐clamp recording pipette; stim, parallel bipolar stimulating electrode; CeL, lateral division of the CeA; CeM, medial division of the CeA. (B) Representative traces of averaged EPSC waveforms (n = 8 consecutive responses) evoked by the PB tract stimulation at different intensities. The top and bottom traces, recordings from mice injected with formalin (thick traces) and saline (thin traces), respectively, and the traces in dashed and solid lines are those from the CGRP WT and KO mice, respectively. (C) Relationship between stimulation intensity (abscissa) and evoked EPSC amplitude (ordinate). The open and filled markers indicate the values of neurons in the CeC of the CGRP WT and KO mice, respectively. The circles, after formalin injection (CGRP WT, n = 19 neurons from 11 mice; CGRP KO, n = 18 neurons from 10 mice); the triangles, saline treated (CGRP WT, n = 11 neurons from five mice; CGRP KO, n = 13 neurons from five mice). Mean ± standard error of the mean (SEM). ***P < 0.001 and **P < 0.01 (vs. CGRP KO [formalin]); ### P < 0.001, ## P < 0.01, and # P < 0.05 (vs. CGRP WT [saline]); ††† P < 0.001 and †† P < 0.01 (vs. CGRP KO [saline]), anova followed by post hoc Gabriel's test. Numbers in parentheses indicate the number of neurons. CGRP, calcitonin gene‐related peptide; WT, wild‐type; KO, knockout.