
Figure 5.
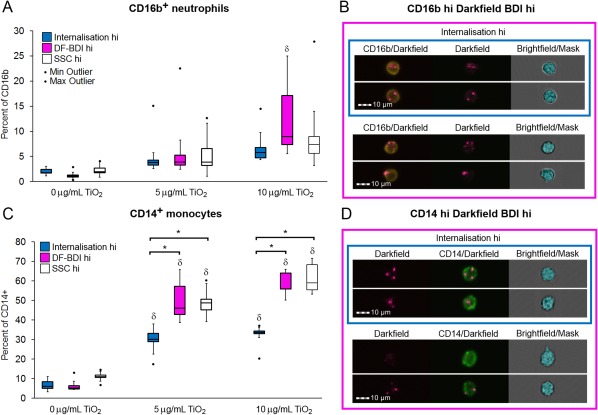
Neutrophil and monocyte association and internalization of TiO2 in whole blood by imaging and conventional flow cytometry. (A) Percentage of CD16b+ neutrophils gated as either internalization hi (blue), DF‐BDI hi (pink), or SSC hi (white) by flow imaging analysis (internalization/DF‐BDI) and flow cytometric analysis (SSC) after incubation with TiO2 in whole blood (n = 7 subjects). δSignificant difference from the control. (B) Example imaging flow analysis images of CD16b+ (yellow) cells residing within the DF‐BDI hi and internalization gates, with the brightfield based internalization mask shown. (C) Percentage of CD14+ monocytes gated as either internalization hi (blue), DF‐BDI hi (pink) or SSC hi (white) by imaging flow analysis (internalization/DF‐BDI) and flow cytometric analysis (SSC) after incubation with TiO2 in whole blood (n 7 subjects). δSignificant difference from the control and *significant differences between techniques as indicated (P ≤ 0.05). (D) Example analysis images of CD14+ (green) cells residing within the DF‐BDI hi and internalization gates, with the brightfield based internalization mask shown. Boxplots display Q1–Q3 with whiskers set at 1.5 × IQR (interquartile range) above the third quartile and 1.5 × IQR below the first quartile, minimum or maximum values that have fallen outside this range are shown as outliers (small black dots). [Color figure can be viewed at wileyonlinelibrary.com]