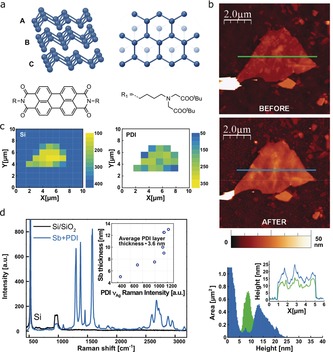
Figure 1.

a) Structure of β‐antimonene (top panel) and the perylene bisimide (PDI) molecule (bottom panel). b) AFM topographic images showing an antimonene flake of about 10 nm of thickness. Top: flake as deposited. Middle: same flake after the functionalization with PDI molecules. Bottom: height histograms of the flake before (green) and after functionalization (blue), showing an average thickness increase of 4.1 nm. The average PDI coverage in all the studied flakes was 3.6 nm. The inset shows representative profiles corresponding to the lines in the images. c) Scanning Raman microscopy (SRM) of the same flake. Left: silicon intensity Raman map showing a decrease in the 521 cm−1 signal which clearly reveals the morphology of the flake. Right: Raman intensity mapping shows the exclusive self‐assembly of the PDI on the antimonene flakes and not on the Si/SiO2 substrate. d) Mean Raman spectra (excitation at 532 nm) of the flake showing the PDI bands as a consequence of the quenching of its fluorescence. The correlation between the PDI νAg Raman intensities and the flake thicknesses is highlighted in the inset.
