
Figure 2.
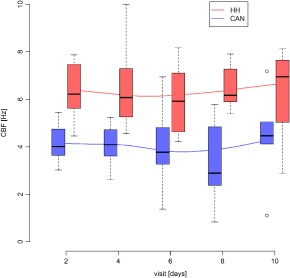
Box‐and‐whisker plot of ciliary beat frequency (CBF) changes in the cold‐air nebulization (CAN) group and the heated humidifier (HH) group. The boxes represent the interquartile range (IQR), with the whiskers extending up to 1.5 times the IQR. The median is marked with a solid line. Outliers are marked with a circle. Visits are shown in days, and CBF in Hz [Color figure can be viewed at wileyonlinelibrary.com]