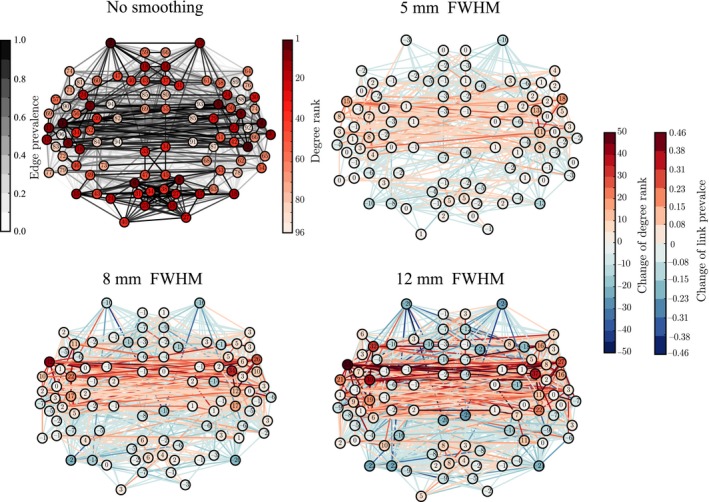
Figure 4.

The ‘hubness’ of the nodes in the temporal lobes, measured in terms of their degree ranks, is increased by smoothing. The values of ranks and rank changes are shown as node labels. The networks corresponding to smoothing kernels of full width at half maximum (FWHM) 5, 8, and 12 mm display differences as compared to the network for non‐smoothed data, similarly to Fig. 3. [Colour figure can be viewed at wileyonlinelibrary.com].
