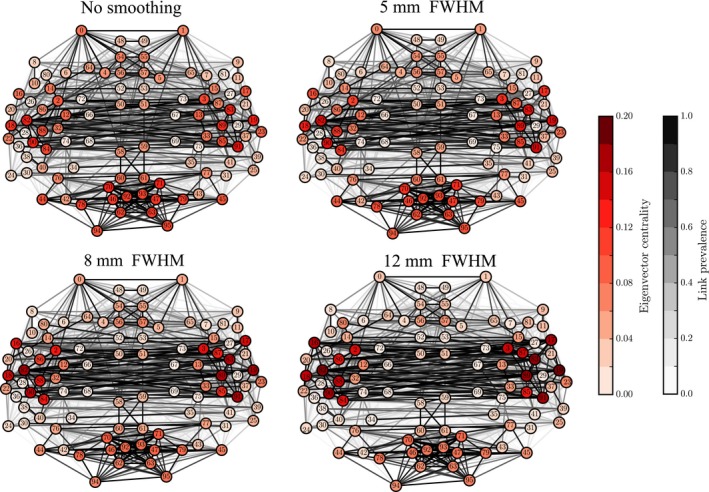
Figure 5.

Changes in eigenvector centralities of nodes due to smoothing reflect the changes in degree and degree ranks, as the largest increase is concentrated around the temporal lobes. In contrast to Figs 3 and 4, node and link colors indicate absolute values of eigenvector centrality and link prevalence instead of differences. [Colour figure can be viewed at wileyonlinelibrary.com].
