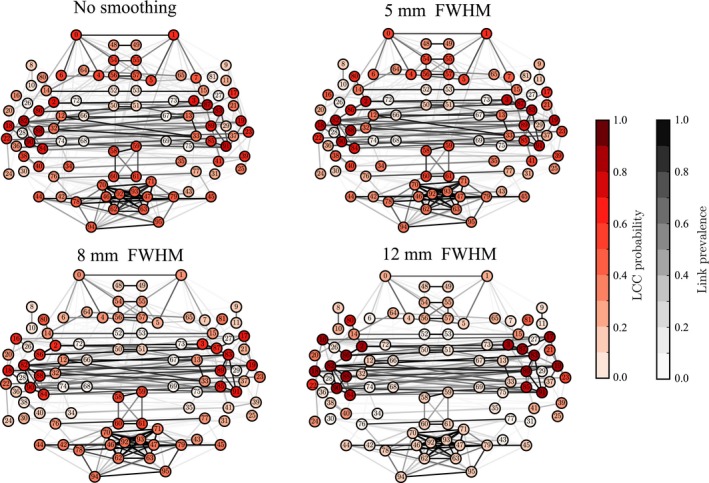
Figure 6.

Spatial smoothing disconnects the frontal and occipital Regions of Interest (ROIs) from the largest connected component (LCC). Node colors indicate how frequently a certain ROI belongs to the LCC in the networks of 13 subjects. Networks are thresholded to 3% density. [Colour figure can be viewed at wileyonlinelibrary.com].
