
Figure 2.
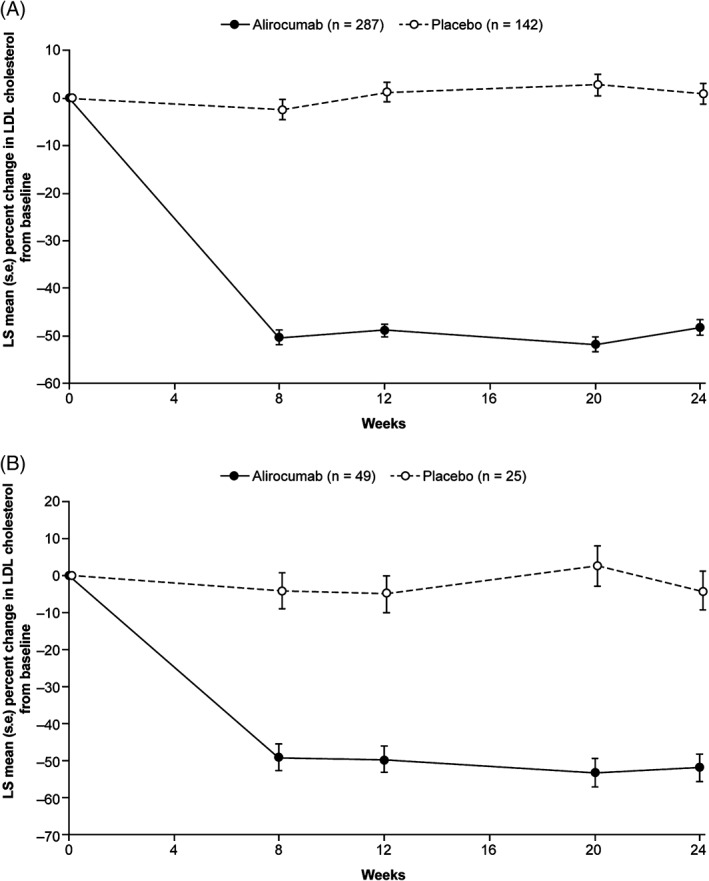
Percent change from baseline in LDL cholesterol over time per treatment randomization. A, Participants with T2D. B, Participants with T1D (intention‐to‐treat analysis)
Official websites use .gov
A
.gov website belongs to an official
government organization in the United States.
Secure .gov websites use HTTPS
A lock (
) or https:// means you've safely
connected to the .gov website. Share sensitive
information only on official, secure websites.
Percent change from baseline in LDL cholesterol over time per treatment randomization. A, Participants with T2D. B, Participants with T1D (intention‐to‐treat analysis)