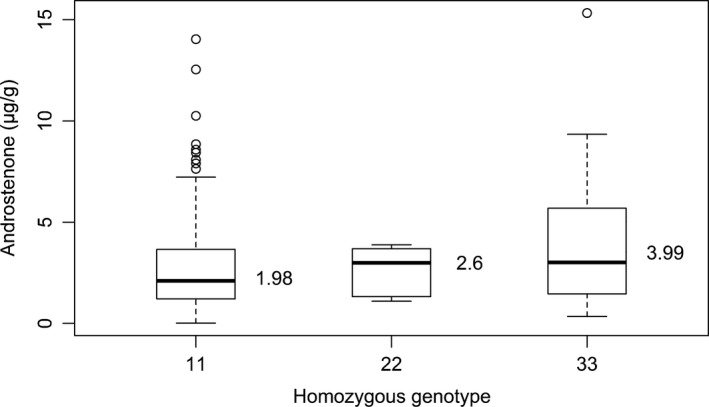
Figure 2.

Boxplots of the distribution of androstenone levels for the haplotype block on SSC5 in Duroc pigs. On the x‐axis are the homozygous haplotypes of the three most common haplotypes. The mean for each homozygous haplotype is given beside the boxes.
