Figure 3.

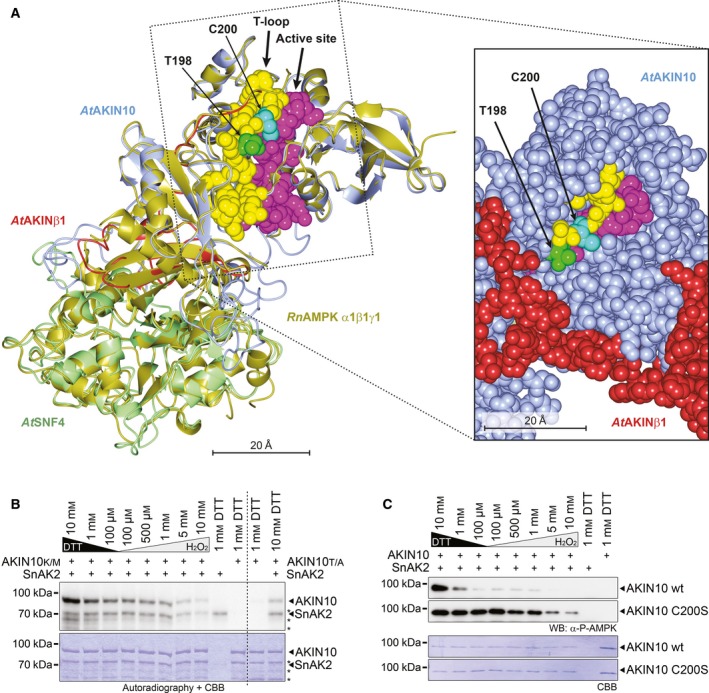
AKIN10 T‐loop phosphorylation by SnAK2 is redox‐dependent. (A) 3D‐structural model of the AtSnRK1 complex based on the crystal structure of the rat Rn AMPK α1β1γ1 heterotrimeric complex. The left image shows a superposition of the Rn AMPK α1β1γ1 crystal structure and the derived AtSnRK1 model. Rn AMPK α1β1γ1 is depicted in gold, At AKIN10 in blue, At AKINβ1 in red and At SNF4 in pale‐green. The T‐loop (yellow) with T198 (green) and C200 (cyan) and the active site (magenta) are highlighted. The image on the right‐hand side details the T‐loop and active site part of SnRK1 in a sphere‐representation with the spheres drawn to represent 1× van der Waals radius (vdwr). (B) In vitro phosphorylation of AKIN10 by SnAK2. Inactive versions of GST‐AKIN10 (K48M = AKIN10K/M and T198A = AKIN10T/A) were incubated with its upstream kinase GST‐SnAK2 (SnAK2) in kinase buffer containing 32P γATP and different concentrations of either DTT or H2O2. The proteins were separated by SDS/PAGE and phosphorylated proteins were detected by subsequent autoradiography. The coomassie brilliant blue (CBB)‐stained gel is shown below. The positions of the full‐length proteins are indicated by arrowheads. Degradation products of GST‐AKIN10 are marked by asterisks. (C) In vitro phosphorylation of the AKIN10 T‐loop Threonine (T198) by SnAK2. Wild‐type GST‐AKIN10 (AKIN10 wt) or the C200S variant (AKIN10 C200S) was incubated with its upstream kinase GST‐SnAK2 (SnAK2) in kinase buffer containing different concentrations of either DTT or H2O2. Threonine 198 phosphorylation in the T‐loop of AKIN10 was visualised by western blotting with a phospho‐specific antibody (α‐P‐AMPK, top). The CBB‐stained membrane is shown below.
