
. 2017 Oct 9;69(11):1714–1723. doi: 10.1002/acr.23165
© 2016, The Authors. Arthritis Care & Research published by Wiley Periodicals, Inc. on behalf of American College of Rheumatology.
This is an open access article under the terms of the Creative Commons Attribution License, which permits use, distribution and reproduction in any medium, provided the original work is properly cited.
Figure 2.
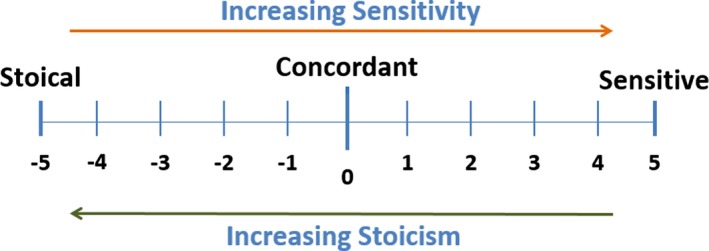
The sensitivity scale used in the study.